Google Analytics in R (Part 2)
In case you missed it, here’s part 1 in a nutshell.
library(googleAnalyticsR)

# Authenticate
googleAuthR::gar_auth_service(
  json_file = "/Users/bgorman/Documents/Projects/R/googleAnalyticsR/gormanalysis-7b0c90a25f87.json",
  scope = "https://www.googleapis.com/auth/analytics.readonly"
)
googleAuthR::gar_set_client(
  json = "/Users/bgorman/Documents/Projects/R/googleAnalyticsR/client_secret.apps.googleusercontent.com.json",
  scopes = c("https://www.googleapis.com/auth/analytics.readonly")
)
## 2020-06-24 08:50:08> Setting client.id from  /Users/bgorman/Documents/Projects/R/googleAnalyticsR/client_secret.apps.googleusercontent.com.json
## [1] "gormanalysis"
# Query list of accounts (to get viewId)
accounts <- ga_account_list()
accounts[, c("accountName", "webPropertyName", "viewId", "viewName")]
## # A tibble: 1 x 4
##   accountName webPropertyName viewId   viewName
##   <chr>       <chr>           <chr>    <chr>
## 1 Ben519      GormAnalysis    79581596 All Web Site Data
Analyses
I think the best way to familiarize yourself with the google analytics API is just to walk through various analyses. So, without further ado..
What happened on March 20th, 2020?
There’s nothing special about this date, but it gives us a concrete time window to analyze some basic metrics like users, sessions, pageviews, etc. The workhorse function we’ll use for just about everything is google_analytics(), and since we’re inspecting
data for 2020-03-20 our calls will look something like this
google_analytics(
  viewId = 79581596,
  date_range = c("2020-03-20", "2020-03-20"),
  # more params...
)
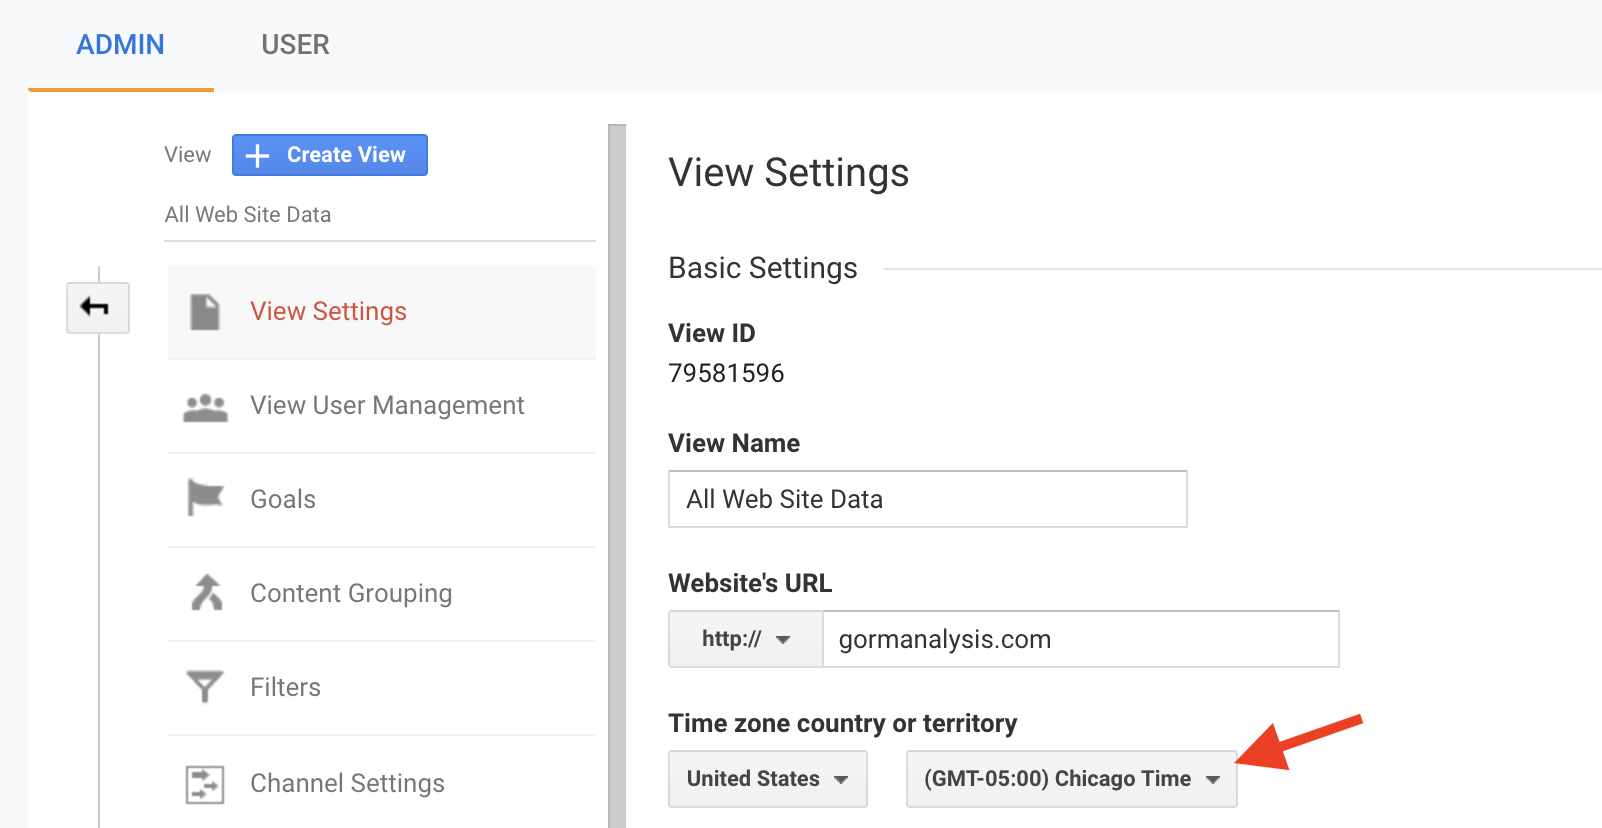
It’s also important to note that the timezone implied by the date range is the timezone of the view you specified with viewId. So, in the example above, 2020-03-20 refers to GMT-05:00 (US Central Time), because that’s how I have my view set up within Analytics.

1. How many users visited my site?
googleAnalyticsR::google_analytics(
  viewId = 79581596,
  date_range = c("2020-03-20", "2020-03-20"),
  metrics = "users"
)
## 2020-06-24 08:50:09> Downloaded [1] rows from a total of [1].
##   users
## 1   384
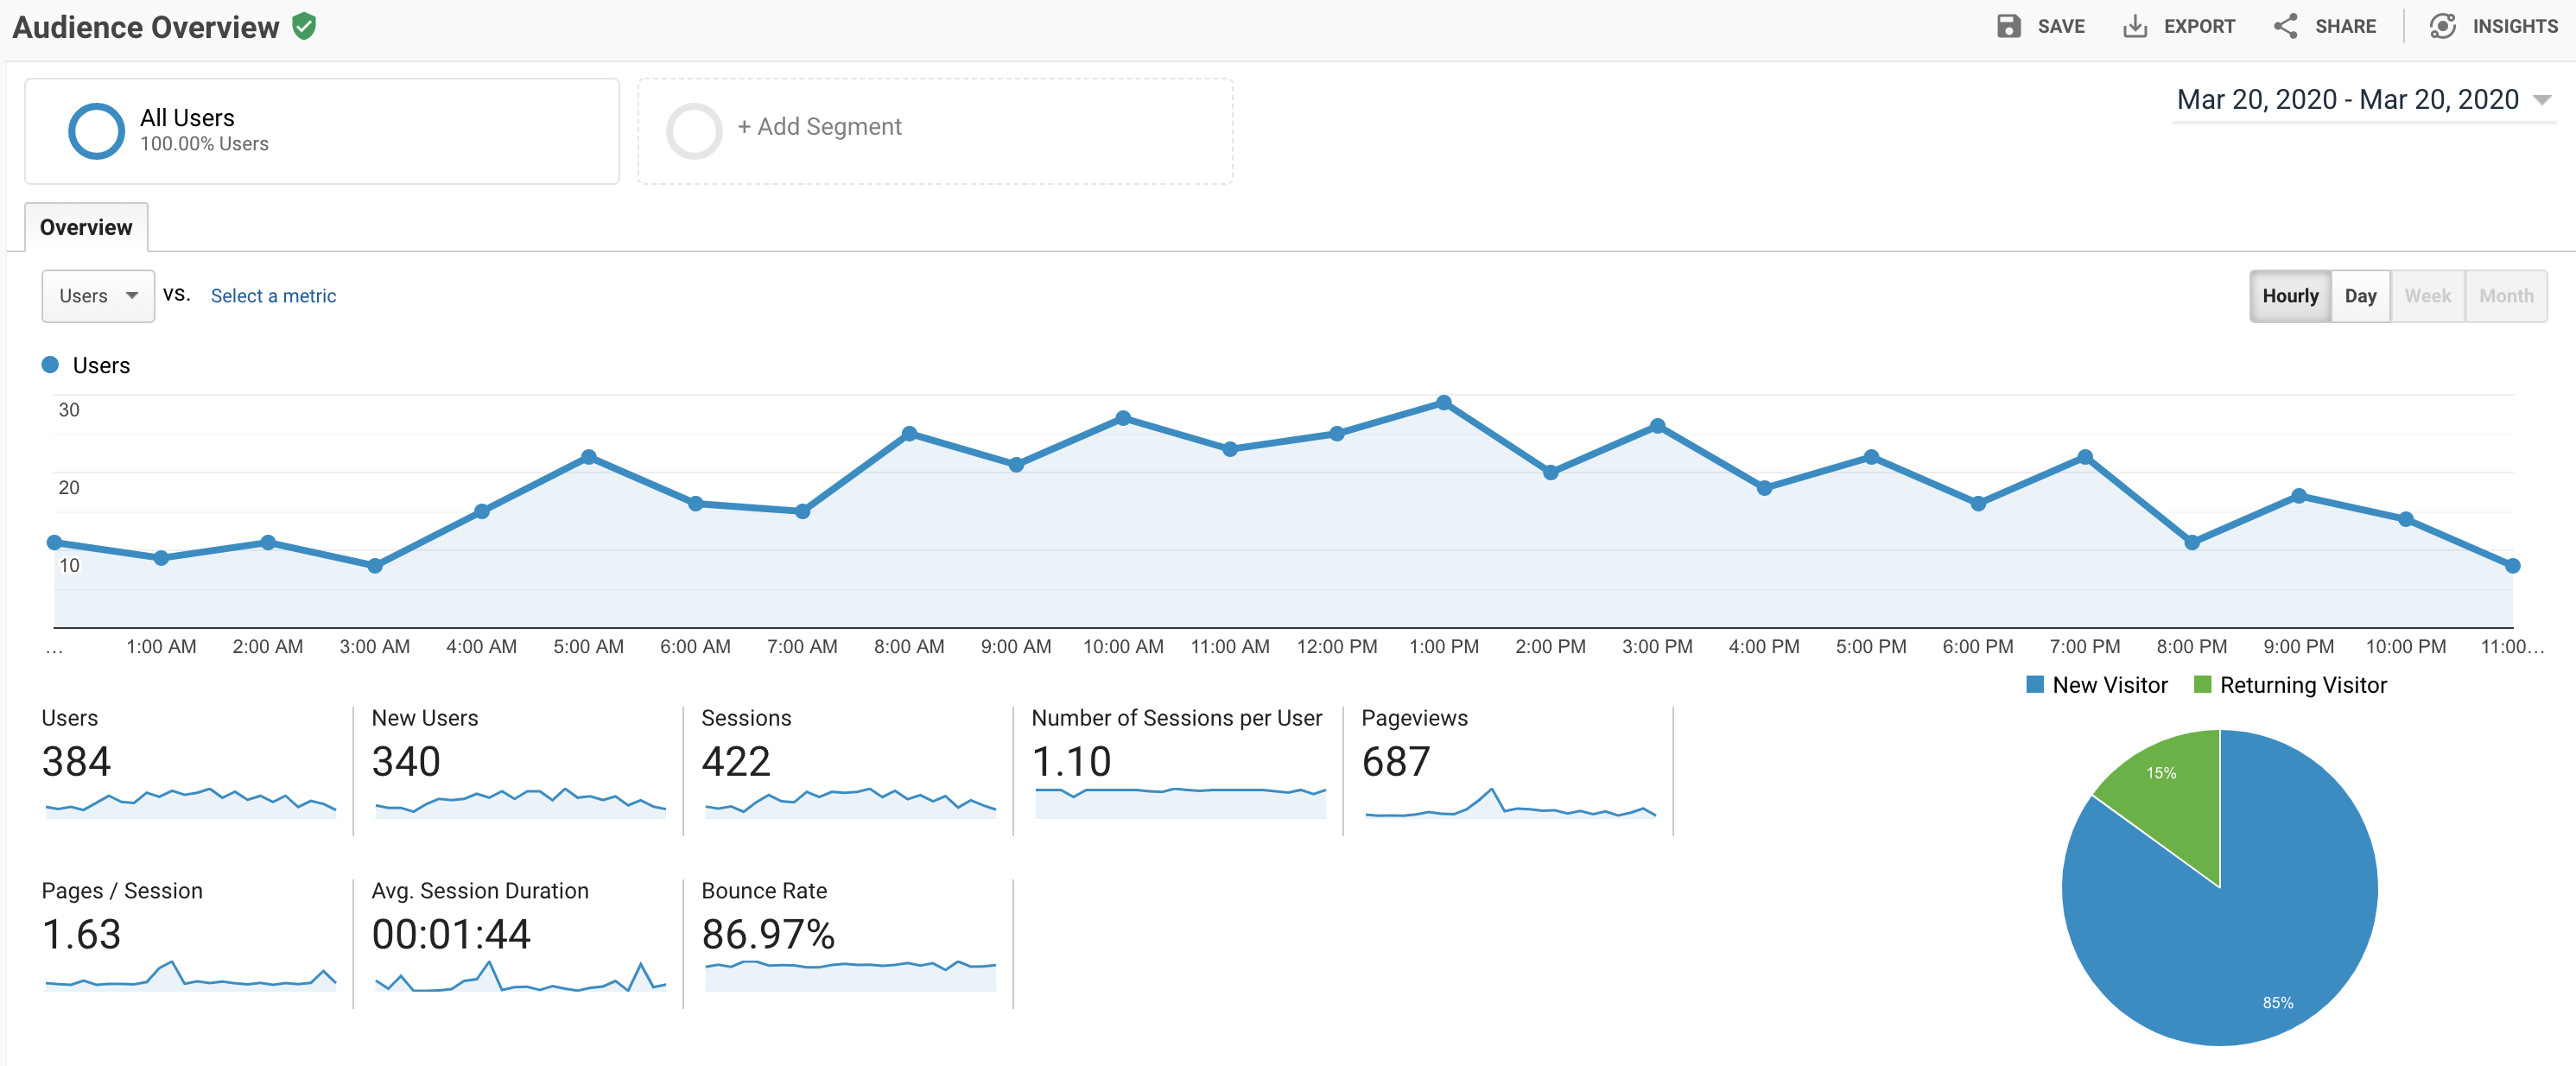
384 users! Nice. Let’s check if this number aligns with the value reported by the Analytics dashboard…

Great. ..But what does this mean? We should take a step back and define what a “user” is and how Google tracks them.
Here’s the nice scenario. Someone hits my site for their very first time. Google then creates a cookie which is stored on their browser for up to two years. Inside that cookie is a randomly created ClientId that uniquely identifies this “user” for the lifetime of the cookie. Upon entering my site, the user initiated a session - specifically visit 0 which identifies them as a new user to my site. Their session expires if
- they go 30 minutes without interacting with my site
- the session length reaches 4 hours (the max allowed session length)
- they revisit my site from another channel, in which case their original session expires and a new session is created.
- The clock strikes midnight. (All sessions for my site expire at midnight.)
Each time this person comes back to my site after their previous session expired, Google records a new session. Given this architecture, there are some important situations to keep in mind.
- If Joe Blow visits my site from two different browsers (e.g. Chrome and Safari), Google will identify two different users.
- If Joe Blow visits my site from two different devices (e.g. phone and desktop), Google will identify two different users.
- If Joe Blow deletes his cookies, the next time he visits my site he’ll be identified as a new user
- If Joe Blow browses my site in Chrome’s Incognito mode, he’ll get a new temporary cookie and be identified as a new user.
2. How many of those users were “new”?
Now let’s see how many of those 384 users were new users to my site. There are a couple ways we could do this.
- The first is to include the newUsers metric in the same report as before
googleAnalyticsR::google_analytics(
  viewId = 79581596,
  date_range = c("2020-03-20", "2020-03-20"),
  metrics = c("users", "newUsers")
)
## 2020-06-24 08:50:10> Downloaded [1] rows from a total of [1].
##   users newUsers
## 1   384      340
- The second is to include the userType dimension.
googleAnalyticsR::google_analytics(
  viewId = 79581596,
  date_range = c("2020-03-20", "2020-03-20"),
  metrics = c("users"),
  dimensions = "userType"
)
## 2020-06-24 08:50:10> Downloaded [2] rows from a total of [2].
##            userType users
## 1       New Visitor   340
## 2 Returning Visitor    60
Pause for a minute, and look at the difference between these reports. They both show that 340 users who visited my site yesterday were new, meaning, they’ve either never visited my site on their current (device, browser) pair in the past, or they deleted their cookies since the last time they came to my site. But, why does the data show 60 returning visitors? If 384 users visited my site and 340 of them were new, shouldn’t Google report 44 returning visitors; not 60?
My understanding of why this happens is that, a new user can get counted as a new user, a new visitor and a returning visitor but not a returning user, on the same day. For example, if Joe Blow visits my site for the very first time at 8AM on March 20th, he gets counted as a new user and a new visitor to my site. Now suppose he re-visits my site later in the same day, at 8PM. At this point, he also gets counted as a returning visitor but not as a returning user.
3. What were the most commonly viewed pages on my site?
Now let’s see something a little more fun - the most commonly viewed pages on my site. At this point, I need to do a bit of digging to figure out exactly what fields to pull from the API. It turns out Google has a “Dimensions & Metrics Explorer” which is incredibly useful for this. I search for “page” and it tells me all related dimension and metric keywords and their descriptions. Then it’s not too hard to craft the following query
pgviews <- googleAnalyticsR::google_analytics(
  viewId = 79581596,
  date_range = c("2020-03-20", "2020-03-20"),
  metrics = c("users", "pageviews"),
  dimensions = "pagePath"
)
## 2020-06-24 08:50:11> Downloaded [66] rows from a total of [66].
head(pgviews[order(-pgviews$pageviews), ], 5)
##                                                      pagePath users pageviews
## 7      /blog/dates-and-times-in-r-without-losing-your-sanity/    93        96
## 52              /blog/reading-and-writing-csv-files-with-cpp/    76        90
## 8                      /blog/decision-trees-in-r-using-rpart/    66        83
## 2  /?viewer_pane=1&capabilities=1&host=http://127.0.0.1:16461     1        53
## 54             /blog/sparse-matrix-construction-and-use-in-r/    26        32
Looks like my blog post on dates and times in R was pretty popular. Also note the 53 page views by one user, on 127.0.0.1:16461. That’s me, visiting my local development site.
Here’s what my top view pages looks like graphically (thanks to a little ggplot2 magic).

4. What pages realed in the most new/returning users?
The next thing I’d like to understand is, what pages on my site are responsible for bringing in new readers? In other words, I want to see what pages were landed on by new users when entering my site for the first time. For this query, I’ll set the dimenions as landingPagePath, and I’ll use a “filtersExpression” setting ga:userType==New Visitor.
landings <- googleAnalyticsR::google_analytics(
  viewId = 79581596,
  date_range = c("2020-03-20", "2020-03-20"),
  metrics = c("users", "pageviews"),
  dimensions = c("landingPagePath"),
  filtersExpression = "ga:userType==New Visitor"
)
## 2020-06-24 08:50:13> Downloaded [39] rows from a total of [39].
head(landings[order(-landings$pageviews), ], 5)
##                                               landingPagePath users pageviews
## 7      /blog/dates-and-times-in-r-without-losing-your-sanity/    87        95
## 31              /blog/reading-and-writing-csv-files-with-cpp/    70        77
## 8                      /blog/decision-trees-in-r-using-rpart/    53        68
## 2  /?viewer_pane=1&capabilities=1&host=http://127.0.0.1:16461     1        29
## 33             /blog/sparse-matrix-construction-and-use-in-r/    23        27
Unsurprisingly, the pages of my site that new users land on are highly similar to the pages viewed by all users.
5. Which pages did people spend the most time reading?
For this, we need to look at ga:avgTimeOnPage by page.
pagetimes <- googleAnalyticsR::google_analytics(
  viewId = 79581596,
  date_range = c("2020-03-20", "2020-03-20"),
  metrics = c("avgTimeOnPage"),
  dimensions = c("pageTitle")
)
## 2020-06-24 08:50:14> Downloaded [62] rows from a total of [62].
pagetimes$avgTimeOnPageMinutes <- pagetimes$avgTimeOnPage/60
head(pagetimes[order(-pagetimes$avgTimeOnPage), ], 5)
##                                    pageTitle avgTimeOnPage avgTimeOnPageMinutes
## 3     An R User's Guide To Setting Up Python     1447.0000             24.11667
## 56    Reading And Writing CSV Files With C++      918.3333             15.30556
## 19 Magic Behind Constructing A Decision Tree      749.0000             12.48333
## 58   Sparse Matrix Construction And Use In R      676.0000             11.26667
## 20        Making A Binary Search Tree in C++      640.2000             10.67000
Here, avgTimeOnPage is given in seconds which we convert to minutes. We also view time on page by pageTitle as opposed to pagePath, for no particular reason other than to do something different.
At first glance it seems people are spending by far the most time reading my post An R User’s Guide To Setting Up Python. But maybe this average is high because it’s based on a tiny sample of page views. So, you might be inclined to check if this page had enough page views to make avgTimeOnPage a credible figure. But there’s a caveat to this metric that’s important to understand..
Suppose someone lands on my home page, spends 30 seconds there, then navigates to my blog page where they spend 10 seconds, then they go to a blog post and spend 2 minutes there before exiting my site. Google gets notified each time the user interacts with my site, so in this example Google collects three timestamps - the time at which the user loaded each page of my site. That means Google can measure the time he spent on my home page and my blog page, but not the time spent on my blog article (the last page he visited before leaving). When Google calculates average time on page, it’ll contribute a 30-second visit to the home page average and a 10-second visit to the blog page average, but it will completely discard this user’s visit to the blog article.
So, in order to check the credibility of each avgTimeOnPage, you need to consider number of page views minus those which were exit pages. You can actually go through the entire calculation yourself if you pull in the right fields, namely
- timeOnPage - the total measured seconds spent on each page
- pageviews - the number of times each page was viewed
- exits - the number of times each page was the last page visited before the user left your site
pagetimes <- googleAnalyticsR::google_analytics(
  viewId = 79581596,
  date_range = c("2020-03-20", "2020-03-20"),
  metrics = c("timeOnPage", "avgTimeOnPage", "pageviews", "exits"),
  dimensions = c("pageTitle")
)
## 2020-06-24 08:50:14> Downloaded [62] rows from a total of [62].
pagetimes$avgTimeOnPageCheck <- pagetimes$timeOnPage/(pagetimes$pageviews - pagetimes$exits)
head(pagetimes[order(-pagetimes$avgTimeOnPage), ], 5)
##                                    pageTitle timeOnPage avgTimeOnPage pageviews
## 3     An R User's Guide To Setting Up Python       1447     1447.0000         1
## 56    Reading And Writing CSV Files With C++       8265      918.3333        90
## 19 Magic Behind Constructing A Decision Tree        749      749.0000         8
## 58   Sparse Matrix Construction And Use In R       3380      676.0000        32
## 20        Making A Binary Search Tree in C++       3201      640.2000        28
##    exits avgTimeOnPageCheck
## 3      0          1447.0000
## 56    81           918.3333
## 19     7           749.0000
## 58    27           676.0000
## 20    23           640.2000
API Quotas
At the time of writing this, Google Analytics allows you 50,000 requests per project per day with a max of 10 requests per second. See this article for more details. You can also monitor the status of your daily quotas from the Analytics API Quotas page in Google Cloud.
 GormAnalysis