Google Analytics in R (Part 1)
In this tutorial, we’ll anlayze the performance of my website using Google Analytics, R, and googleAnalyticsR.
Setup
Before we get started with R, I’m assuming you have some basic familiarity with Google Analytics. For example, if you want to use Google Analytics with R, you’ll obviously need to set up a Google Analytics account and property (i.e. website), and you’ll need to insert your google analytics tracking code into your website.
R Packages
We’ll use three packages to pull data from Google Analytics.
googleAnalyticsR is the workhorse that implements most of the stuff we need. googleAuthR handles authentication to the google cloud platform.
You can install these packages via
install.packages("googleAuthR")
install.packages("googleAnalyticsR")
Google Cloud Platform
Buckle up. This is the hard part. If you follow these instructions closely (and google doesn’t change the process anytime soon) you should be okay.
- Create a project on Google Cloud Platform. I’ll call mine “gormanalysis”.
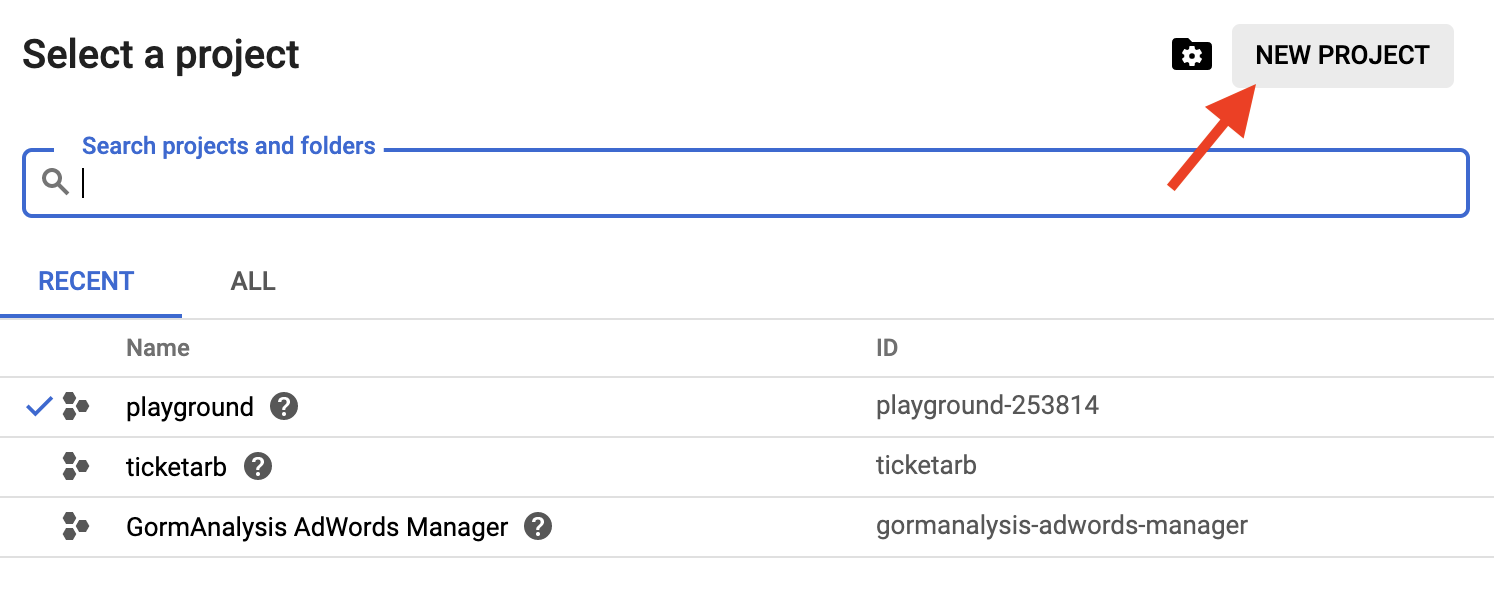
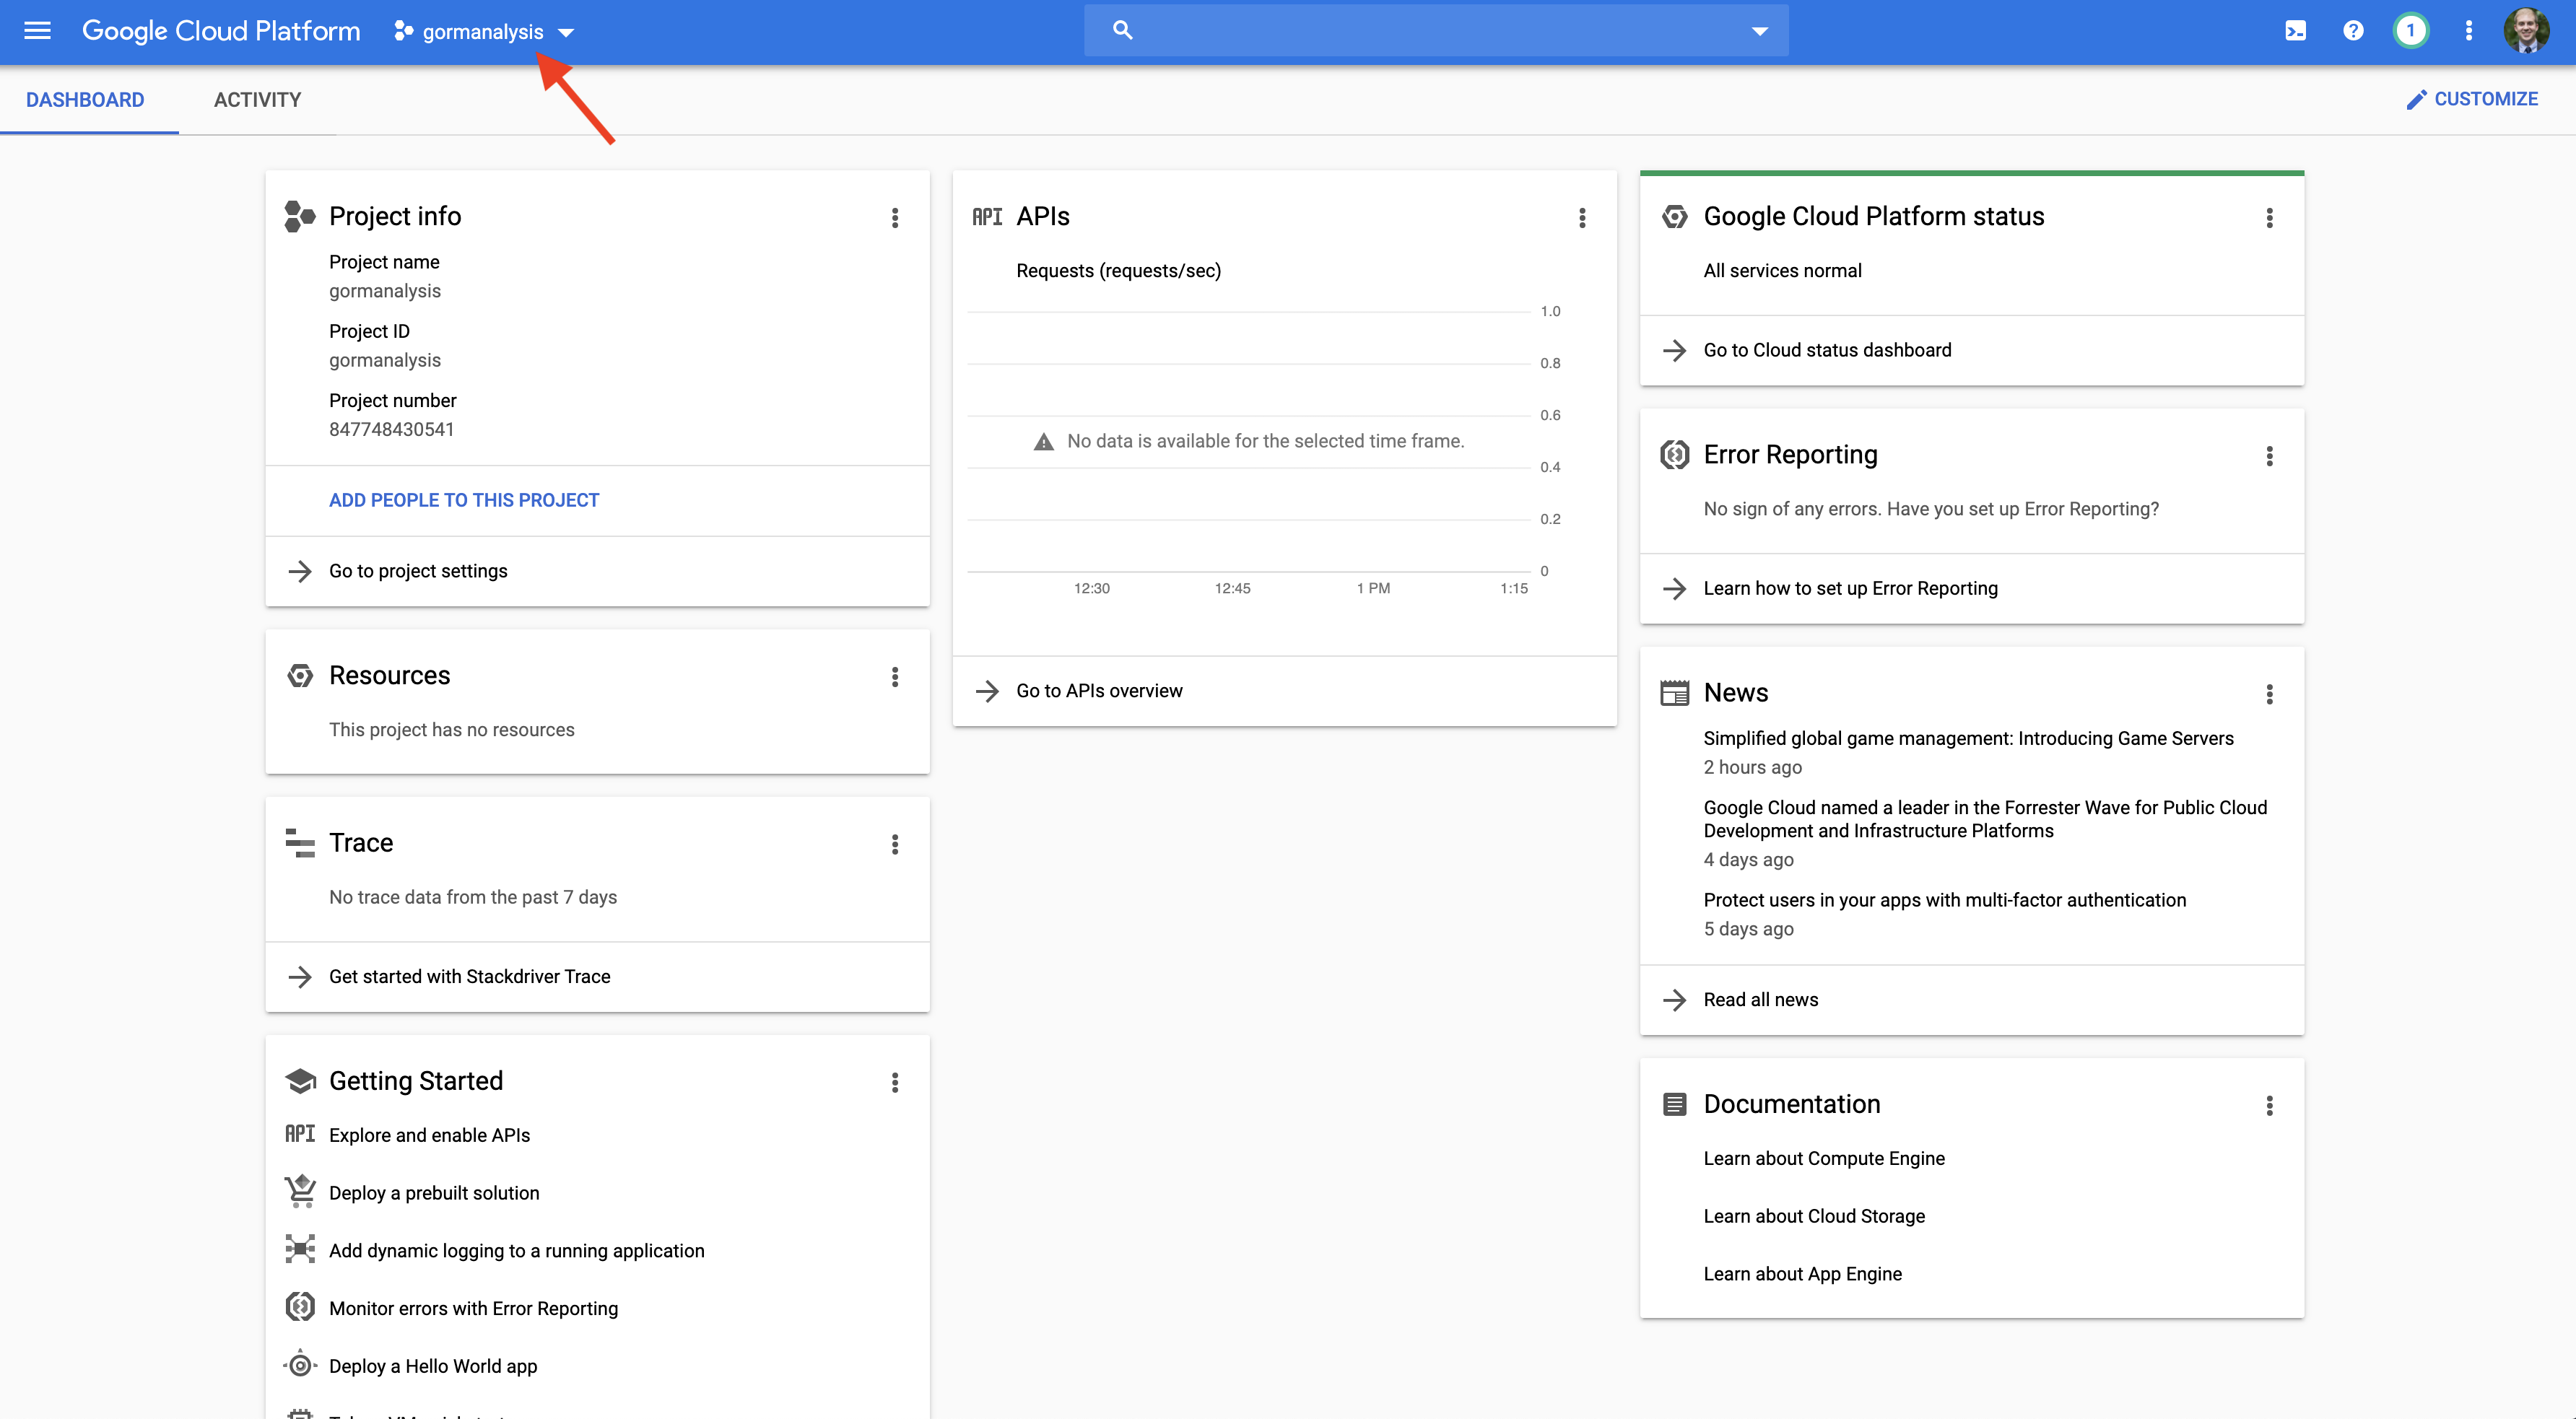
- Make sure your new project is selected in the Google Cloud Console.
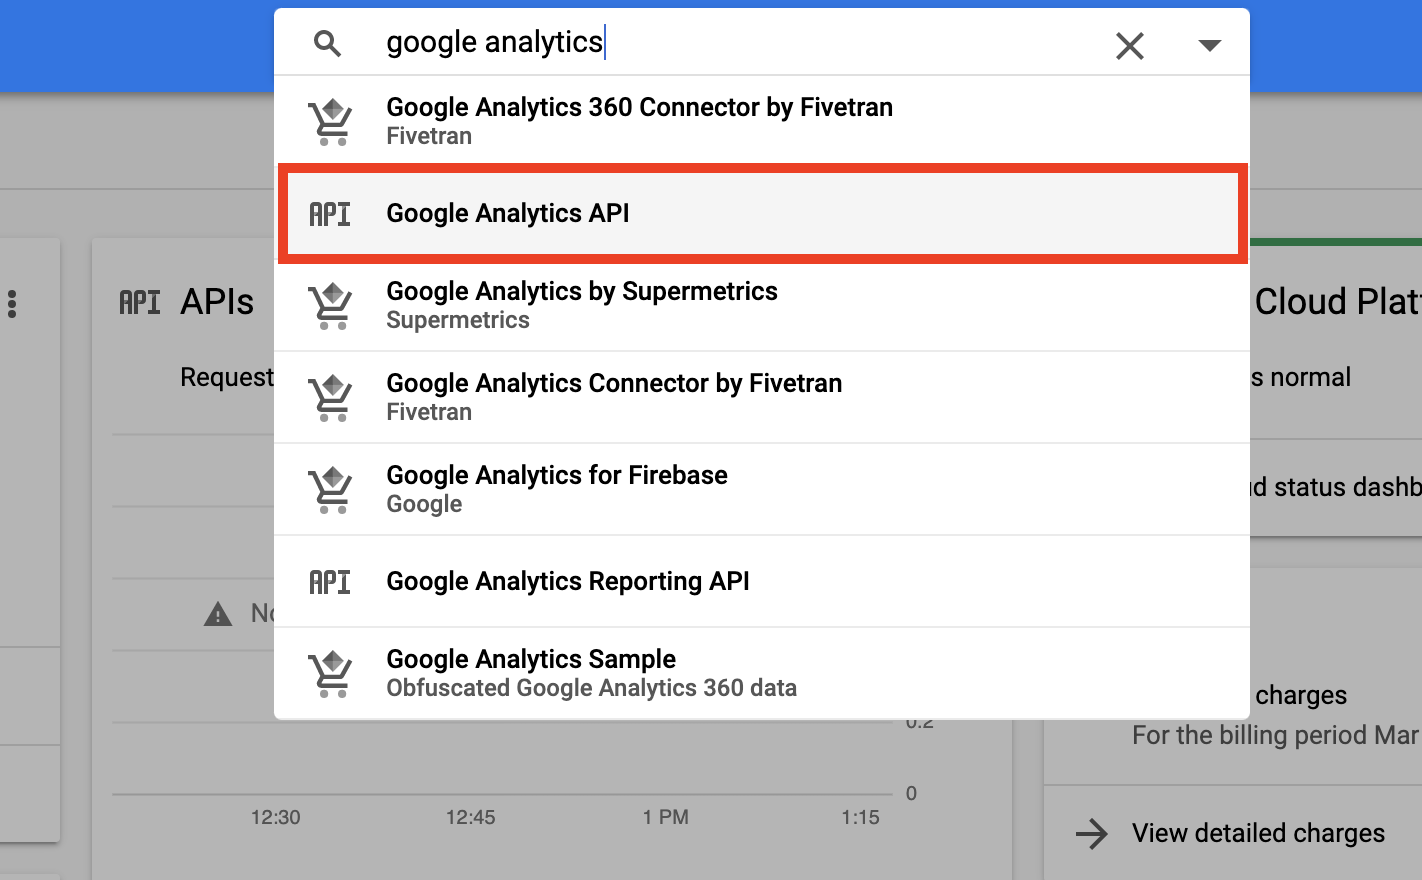
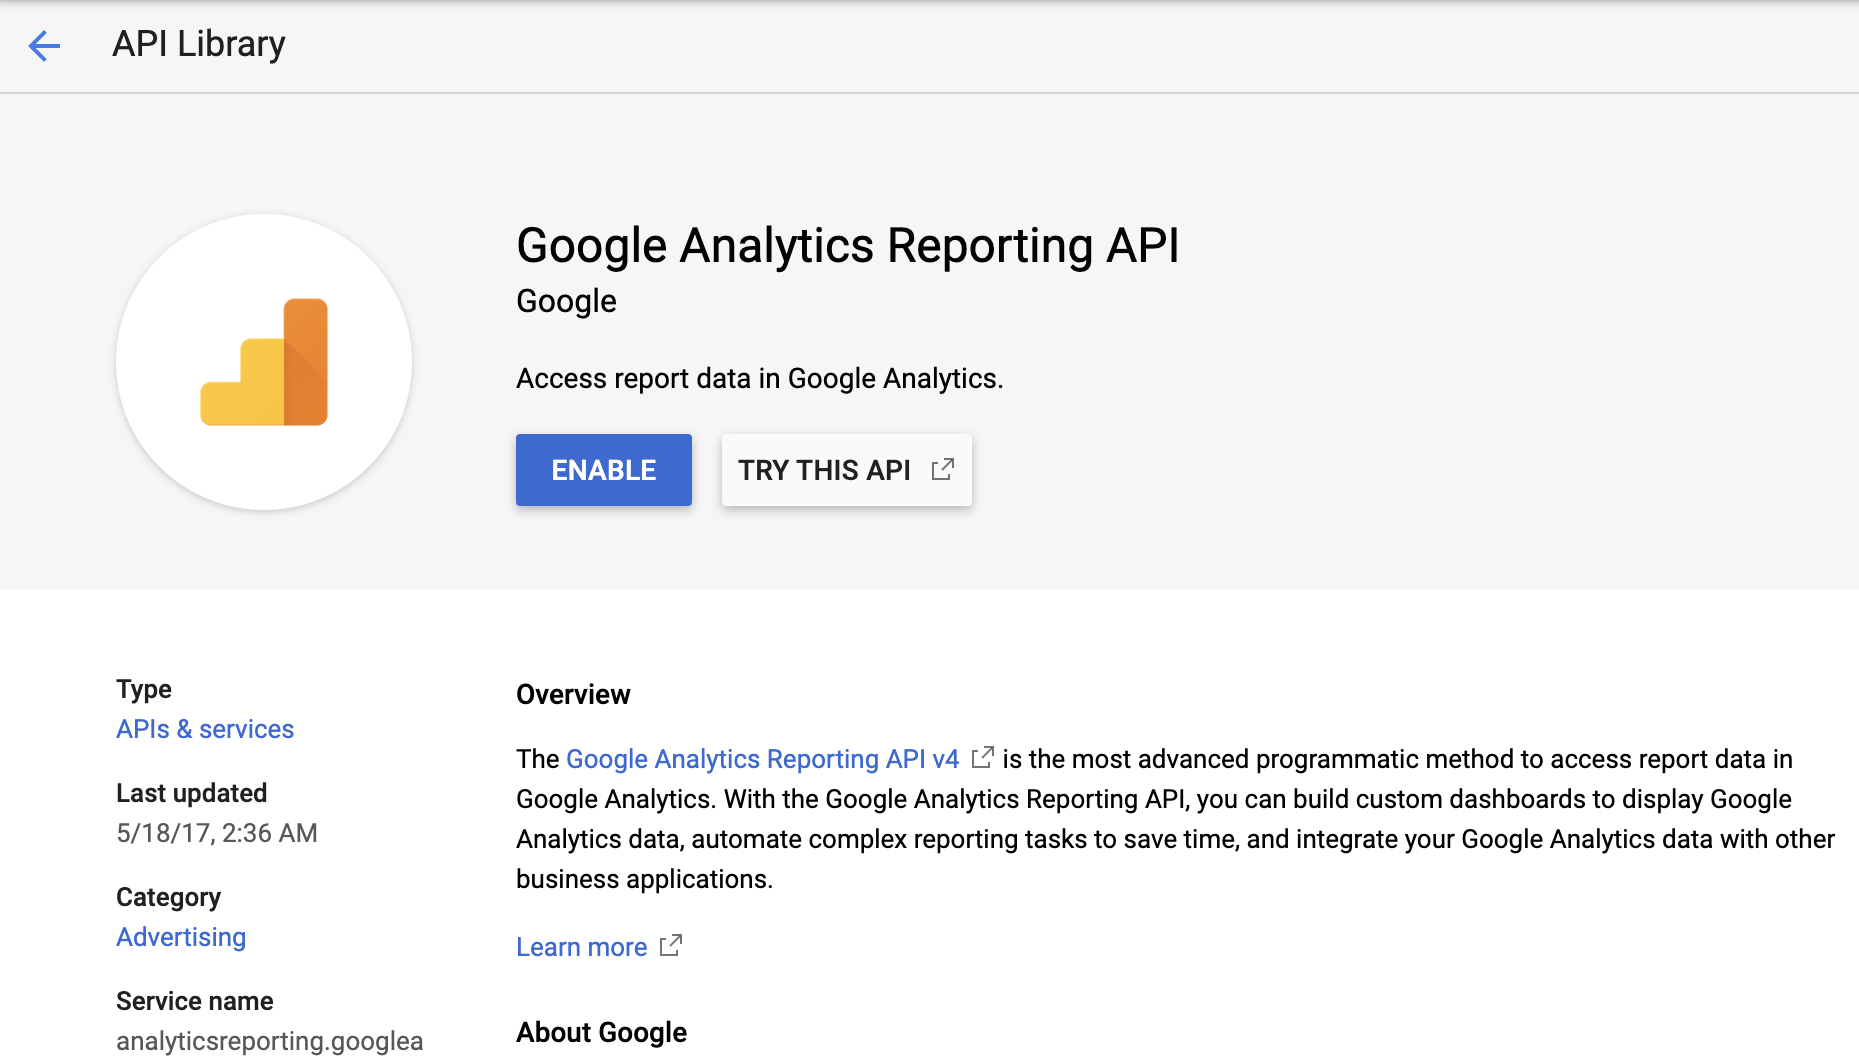
- Search for and choose “Google Analytics” in the console search bar.
- Enable the Google Analytics API.
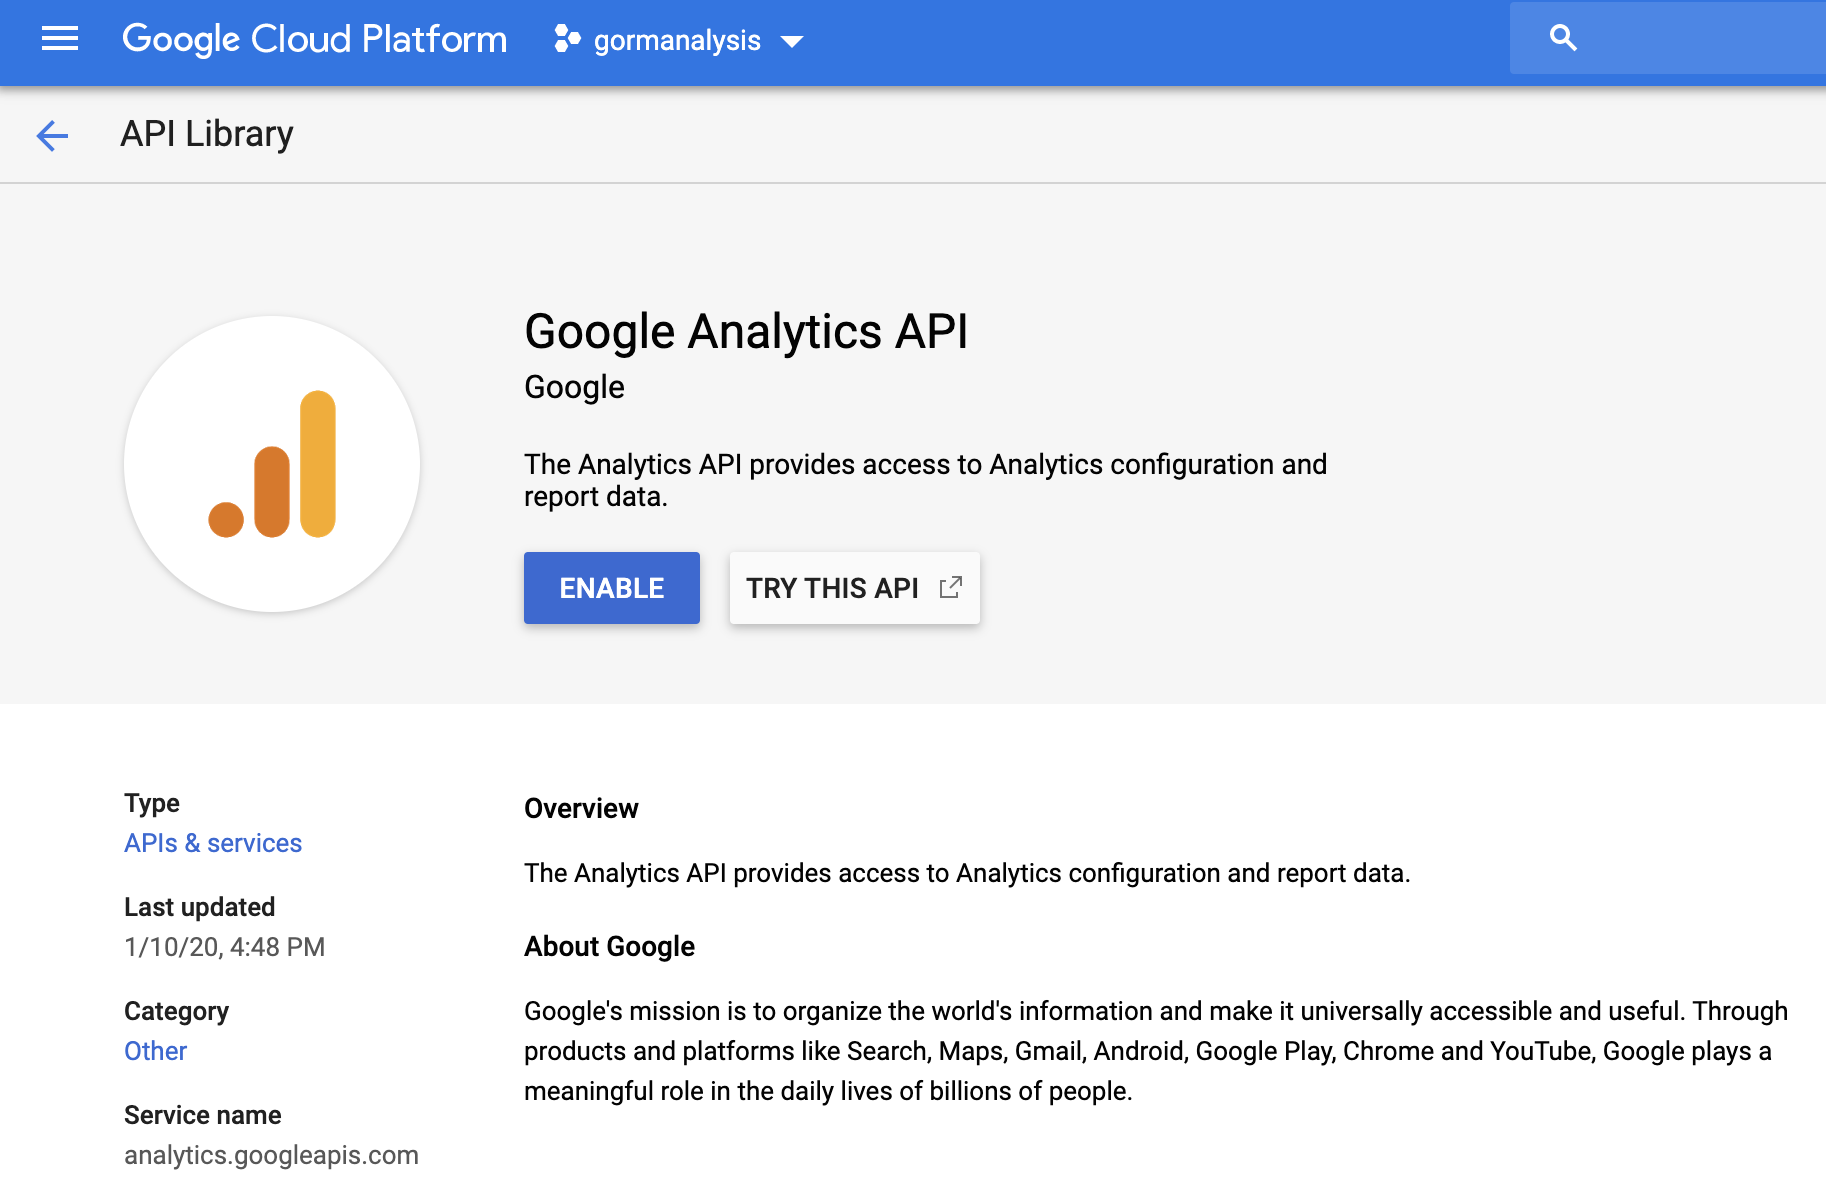
- Repeat steps 3 & 4, enabling the Google Analytics Reporting API.
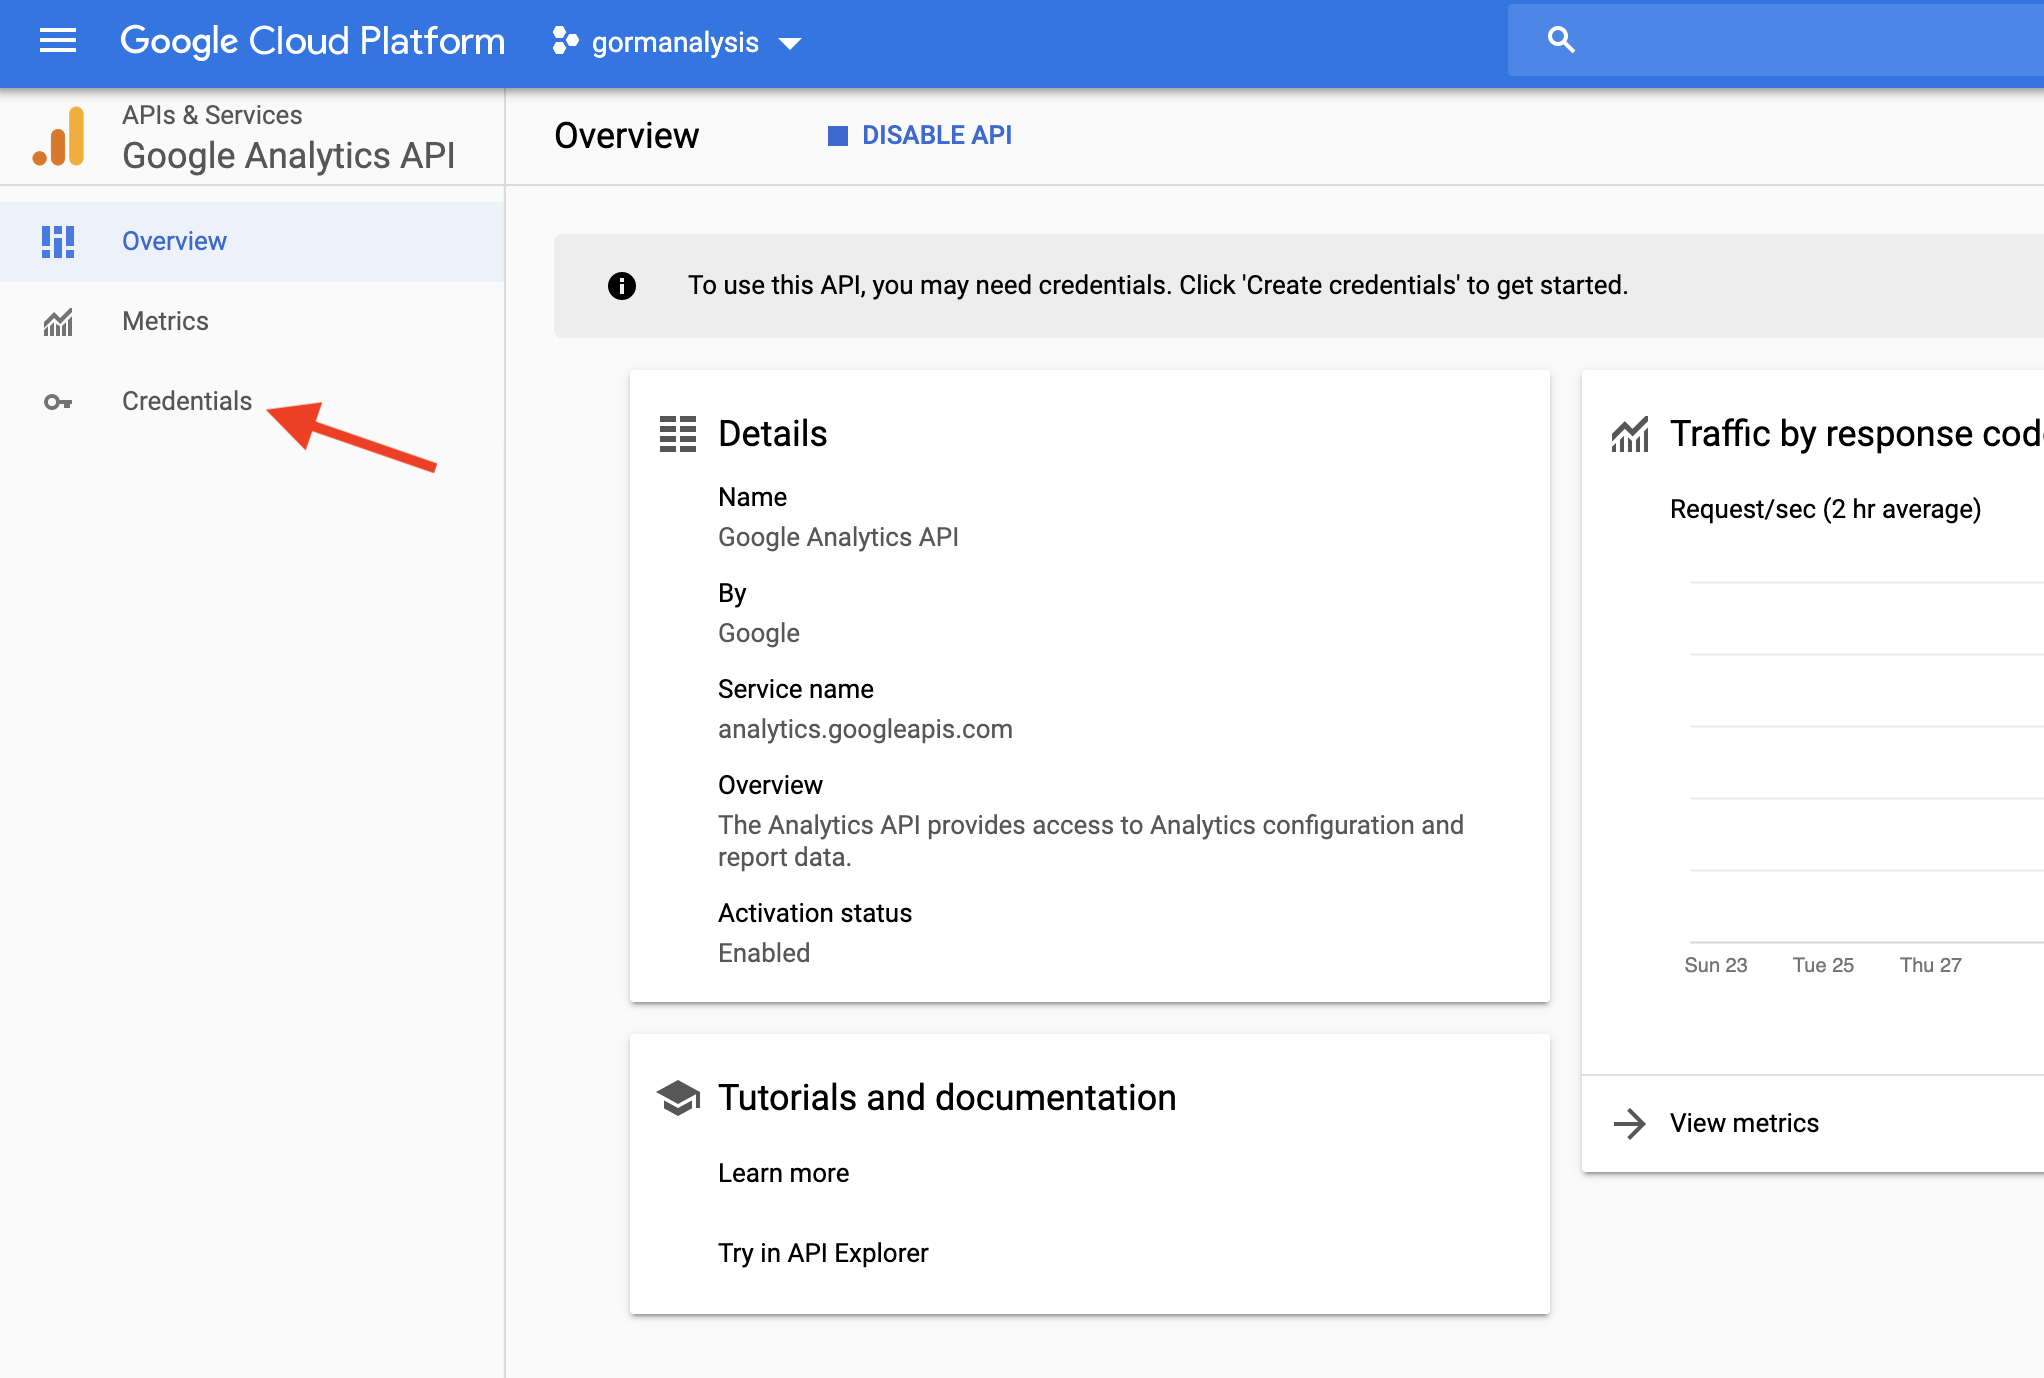
- Click on Credentials
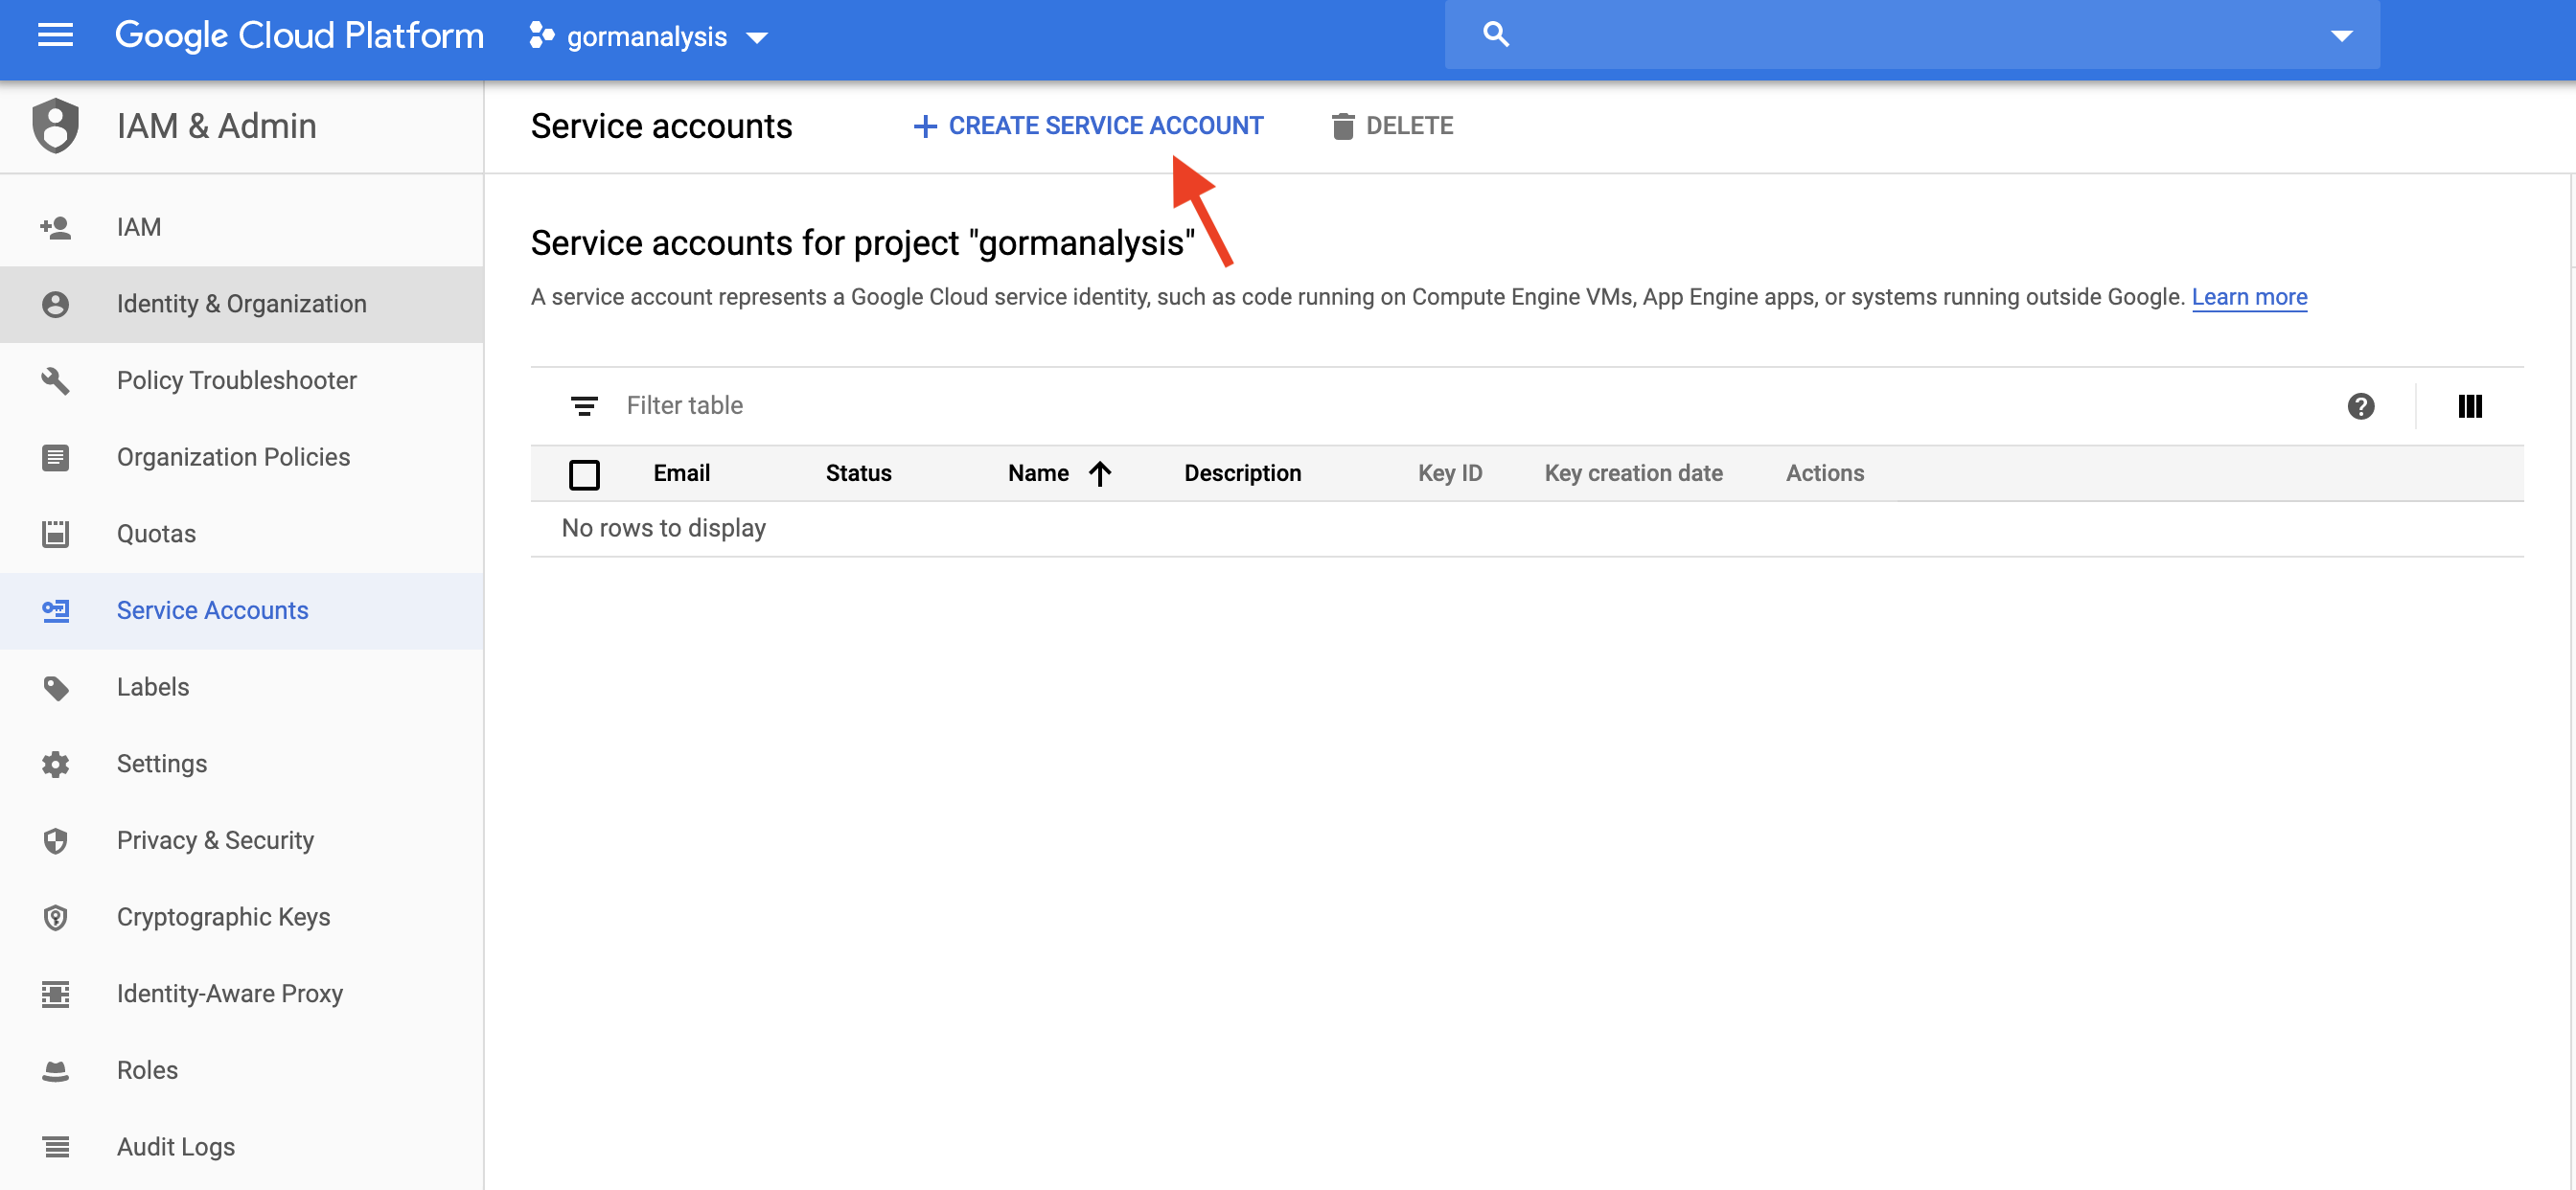
- Manage Service Accounts

- Create Service Account
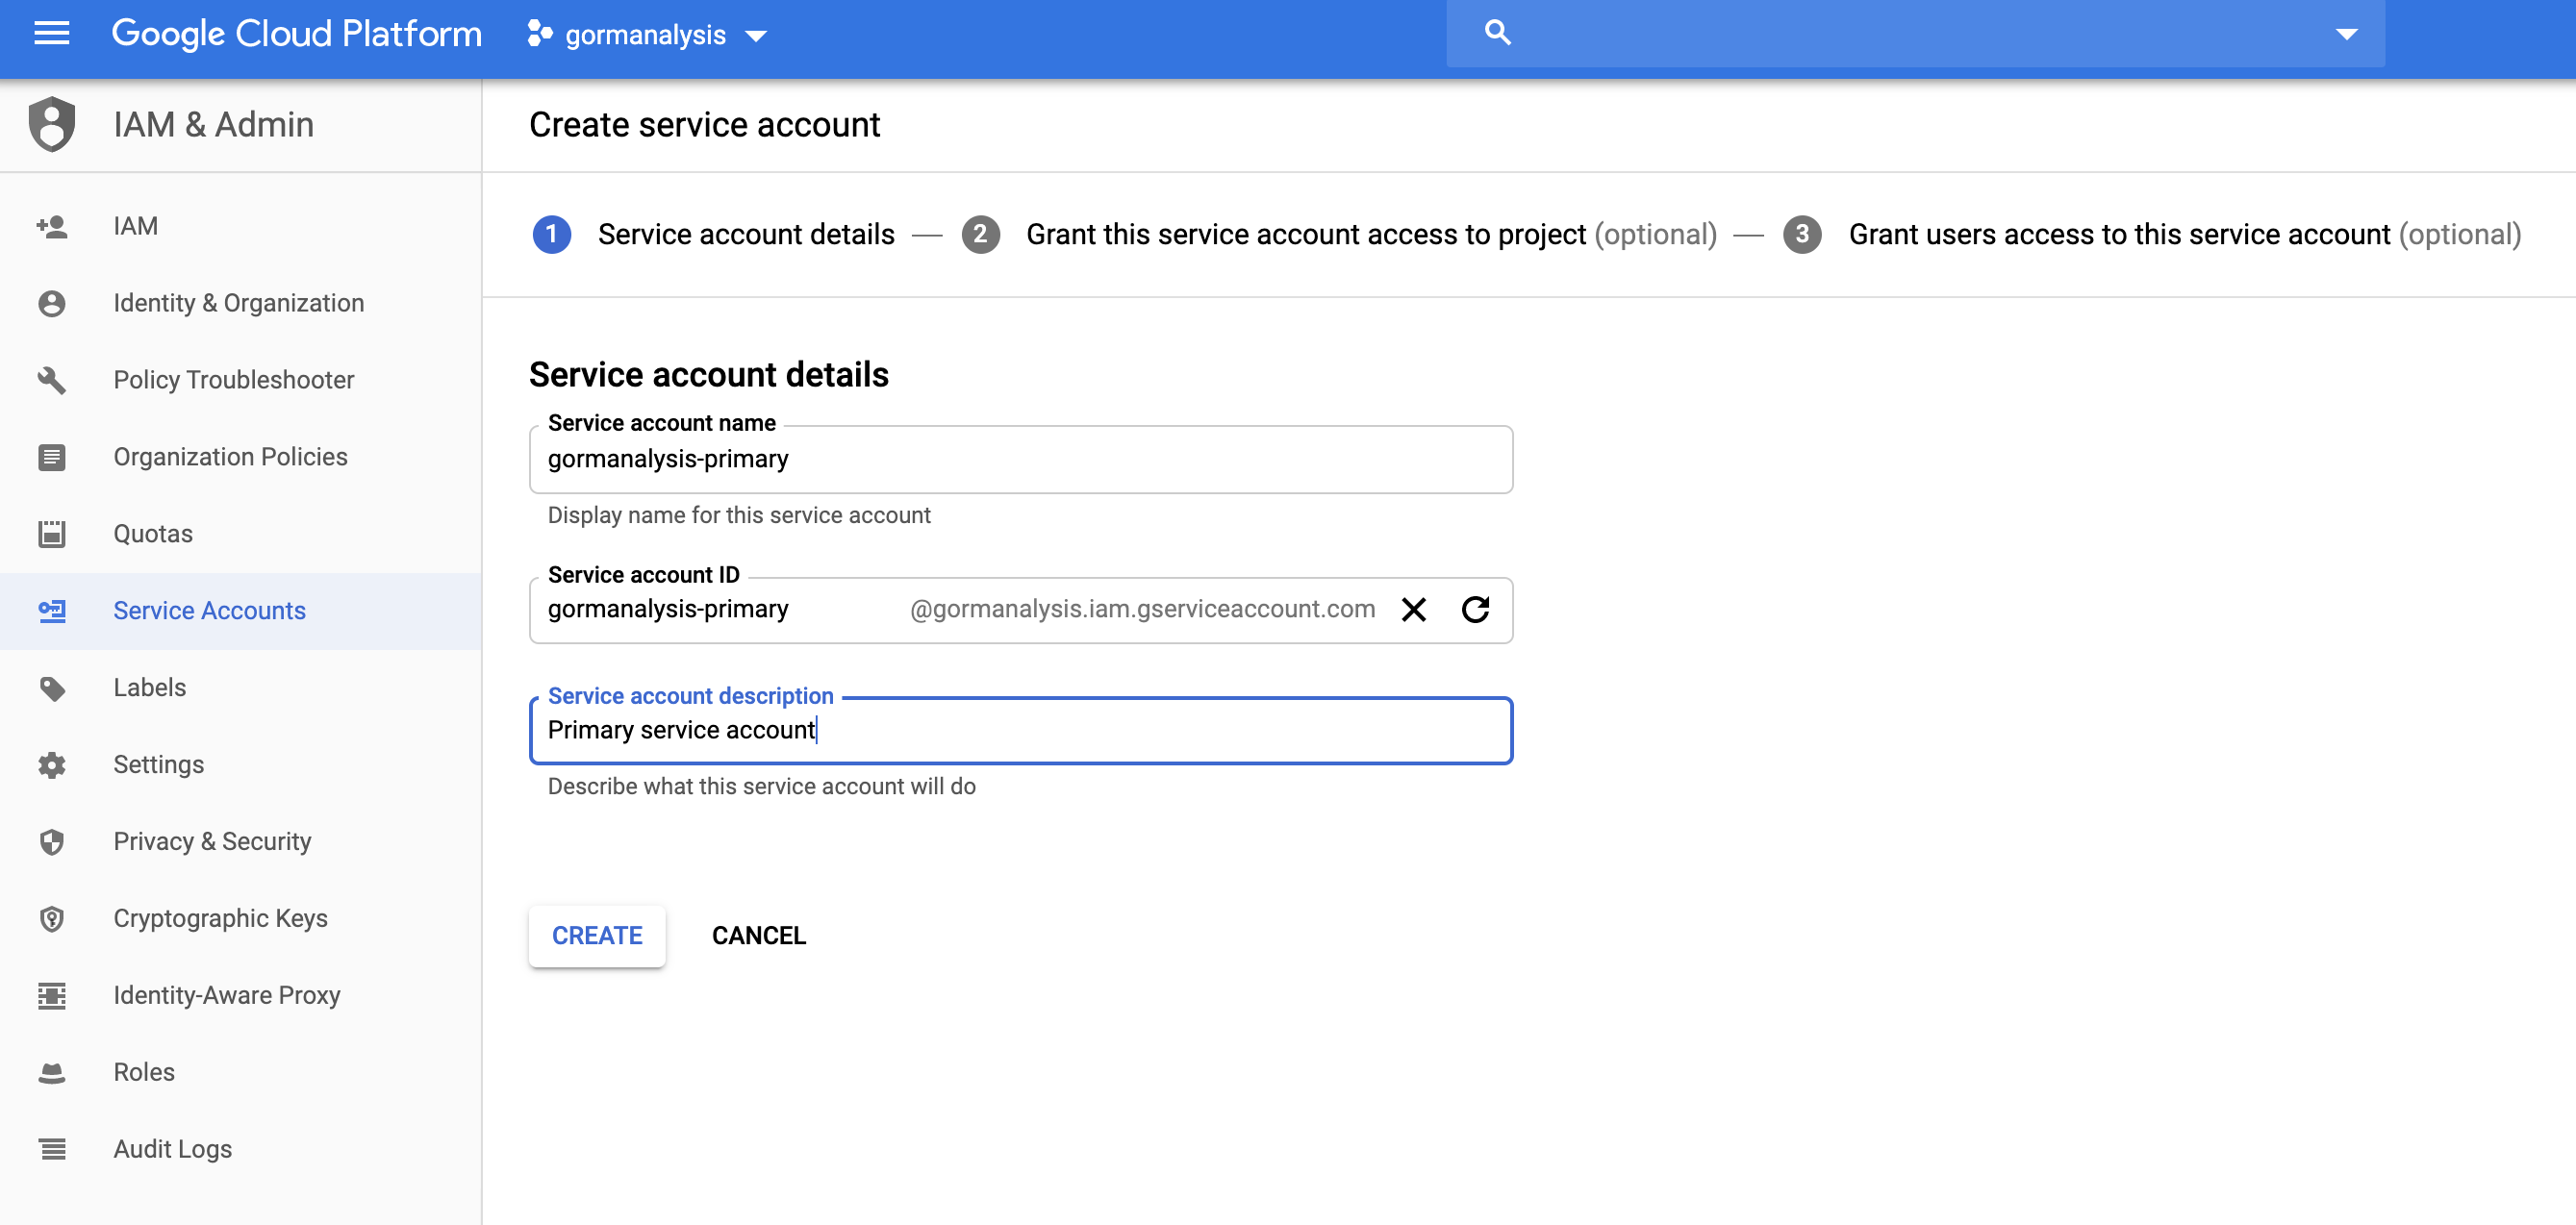
- Give your service account a name. I’ll call mine “gormanalysis-primary”
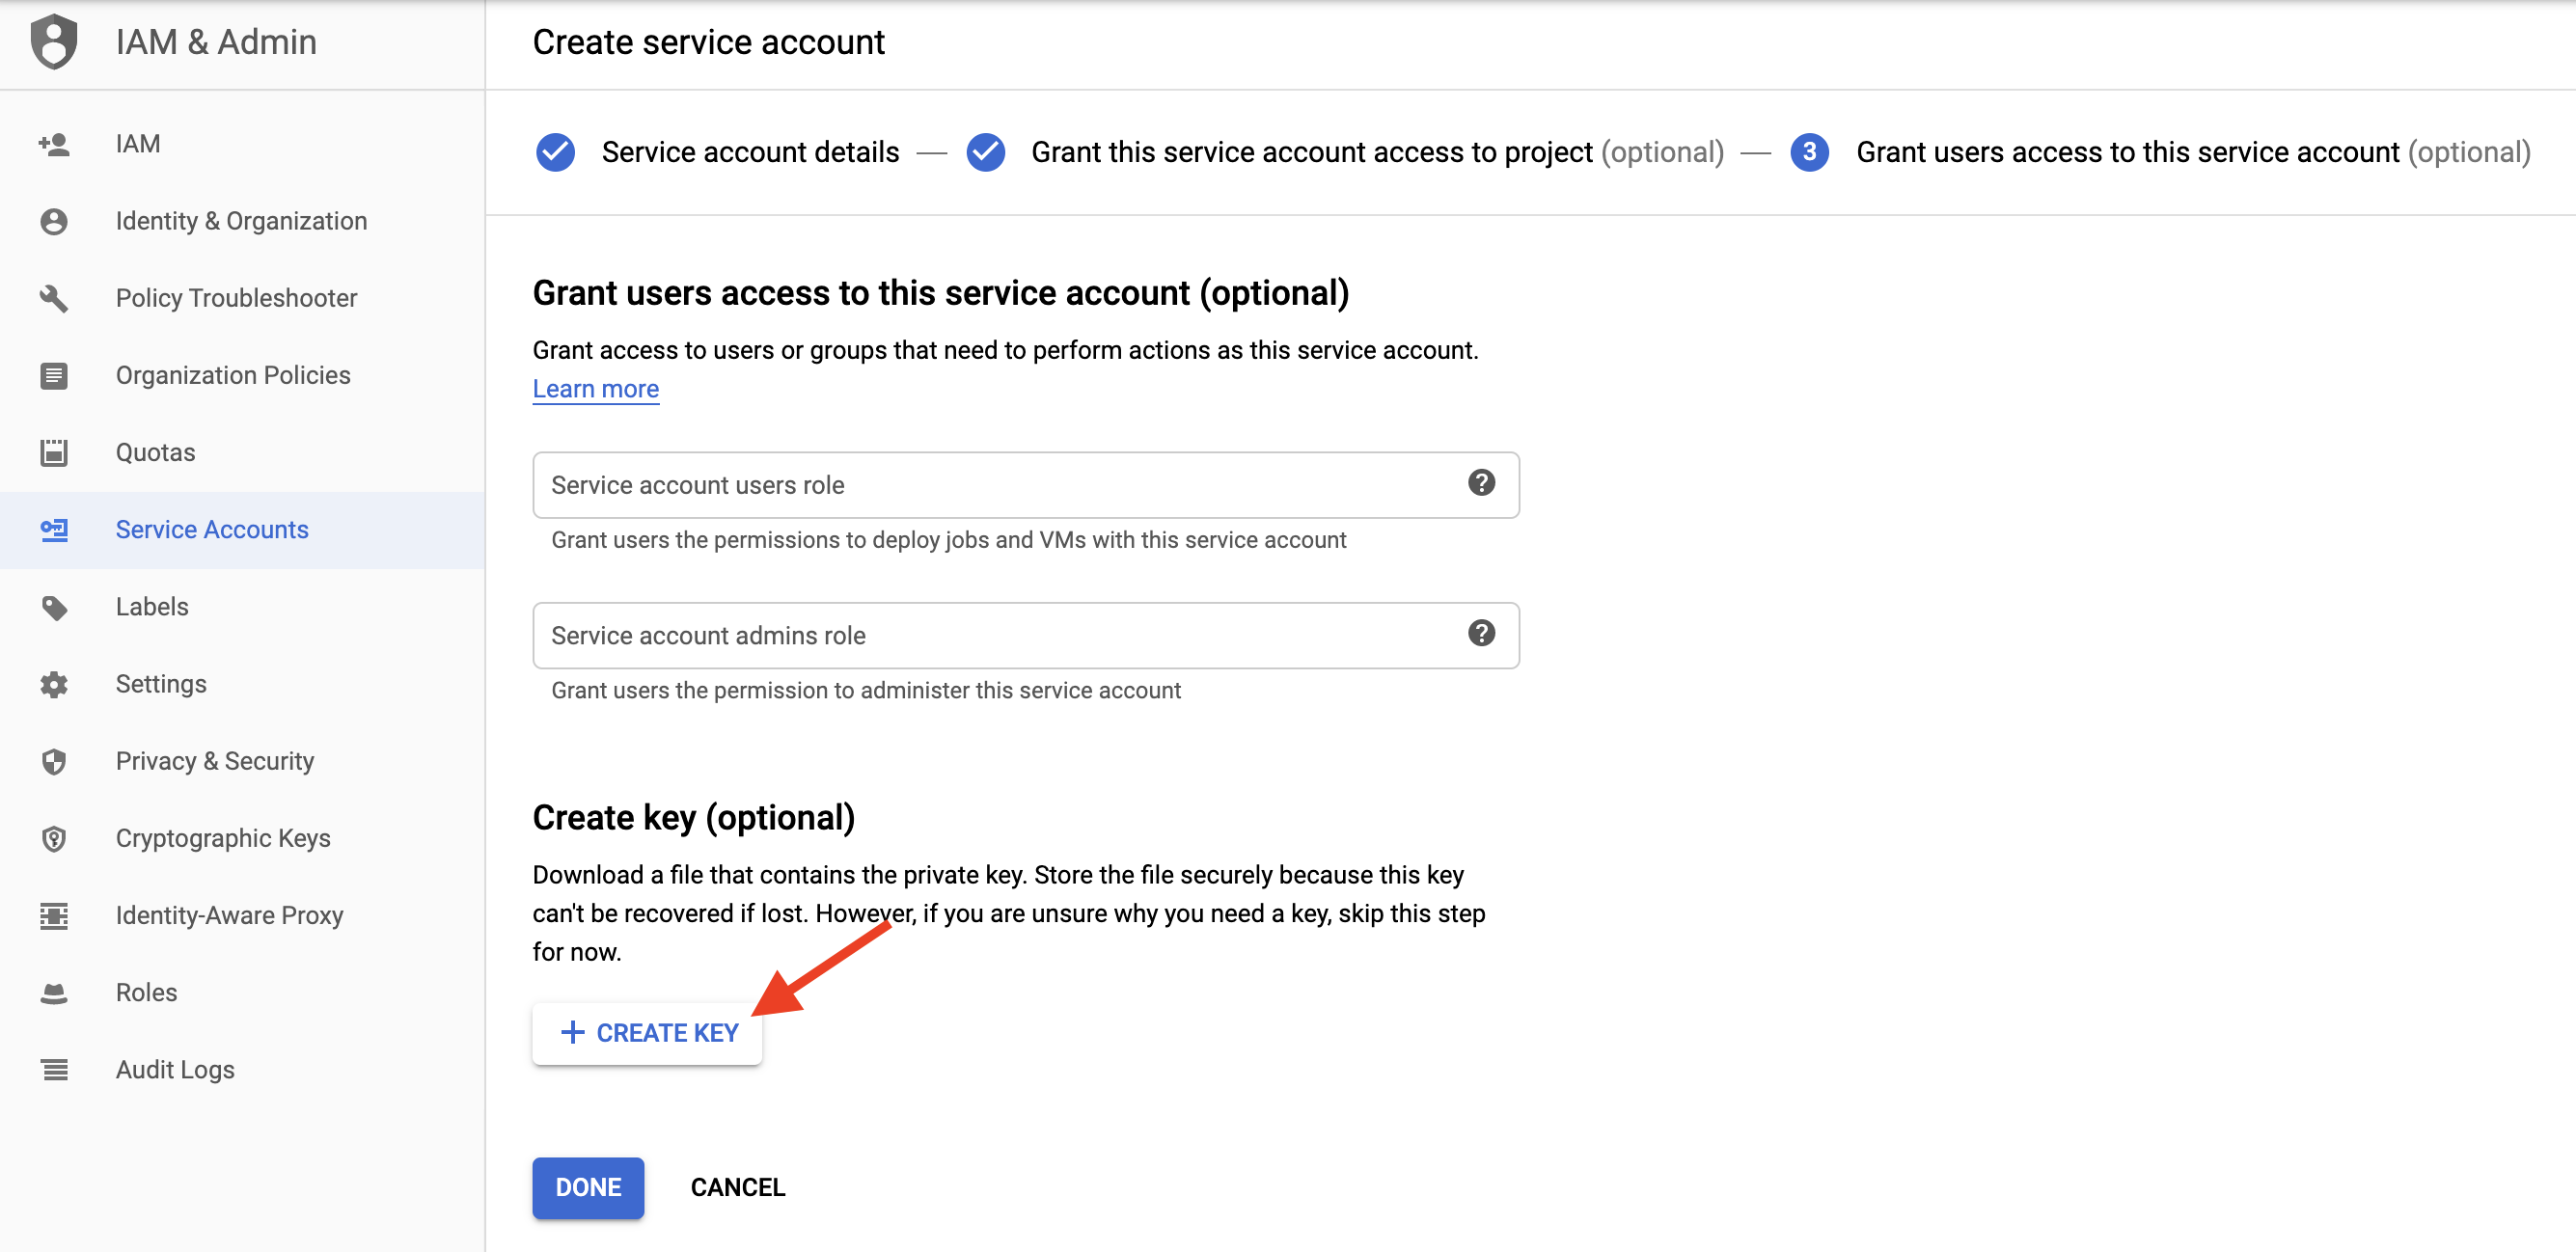
- Click CREATE KEY. This should generate a key in the form of a json file like gormanalysis-6c0c90a25f78.json. Put this key somewhere secure and don’t share it with anyone (e.g. don’t upload it to github!).
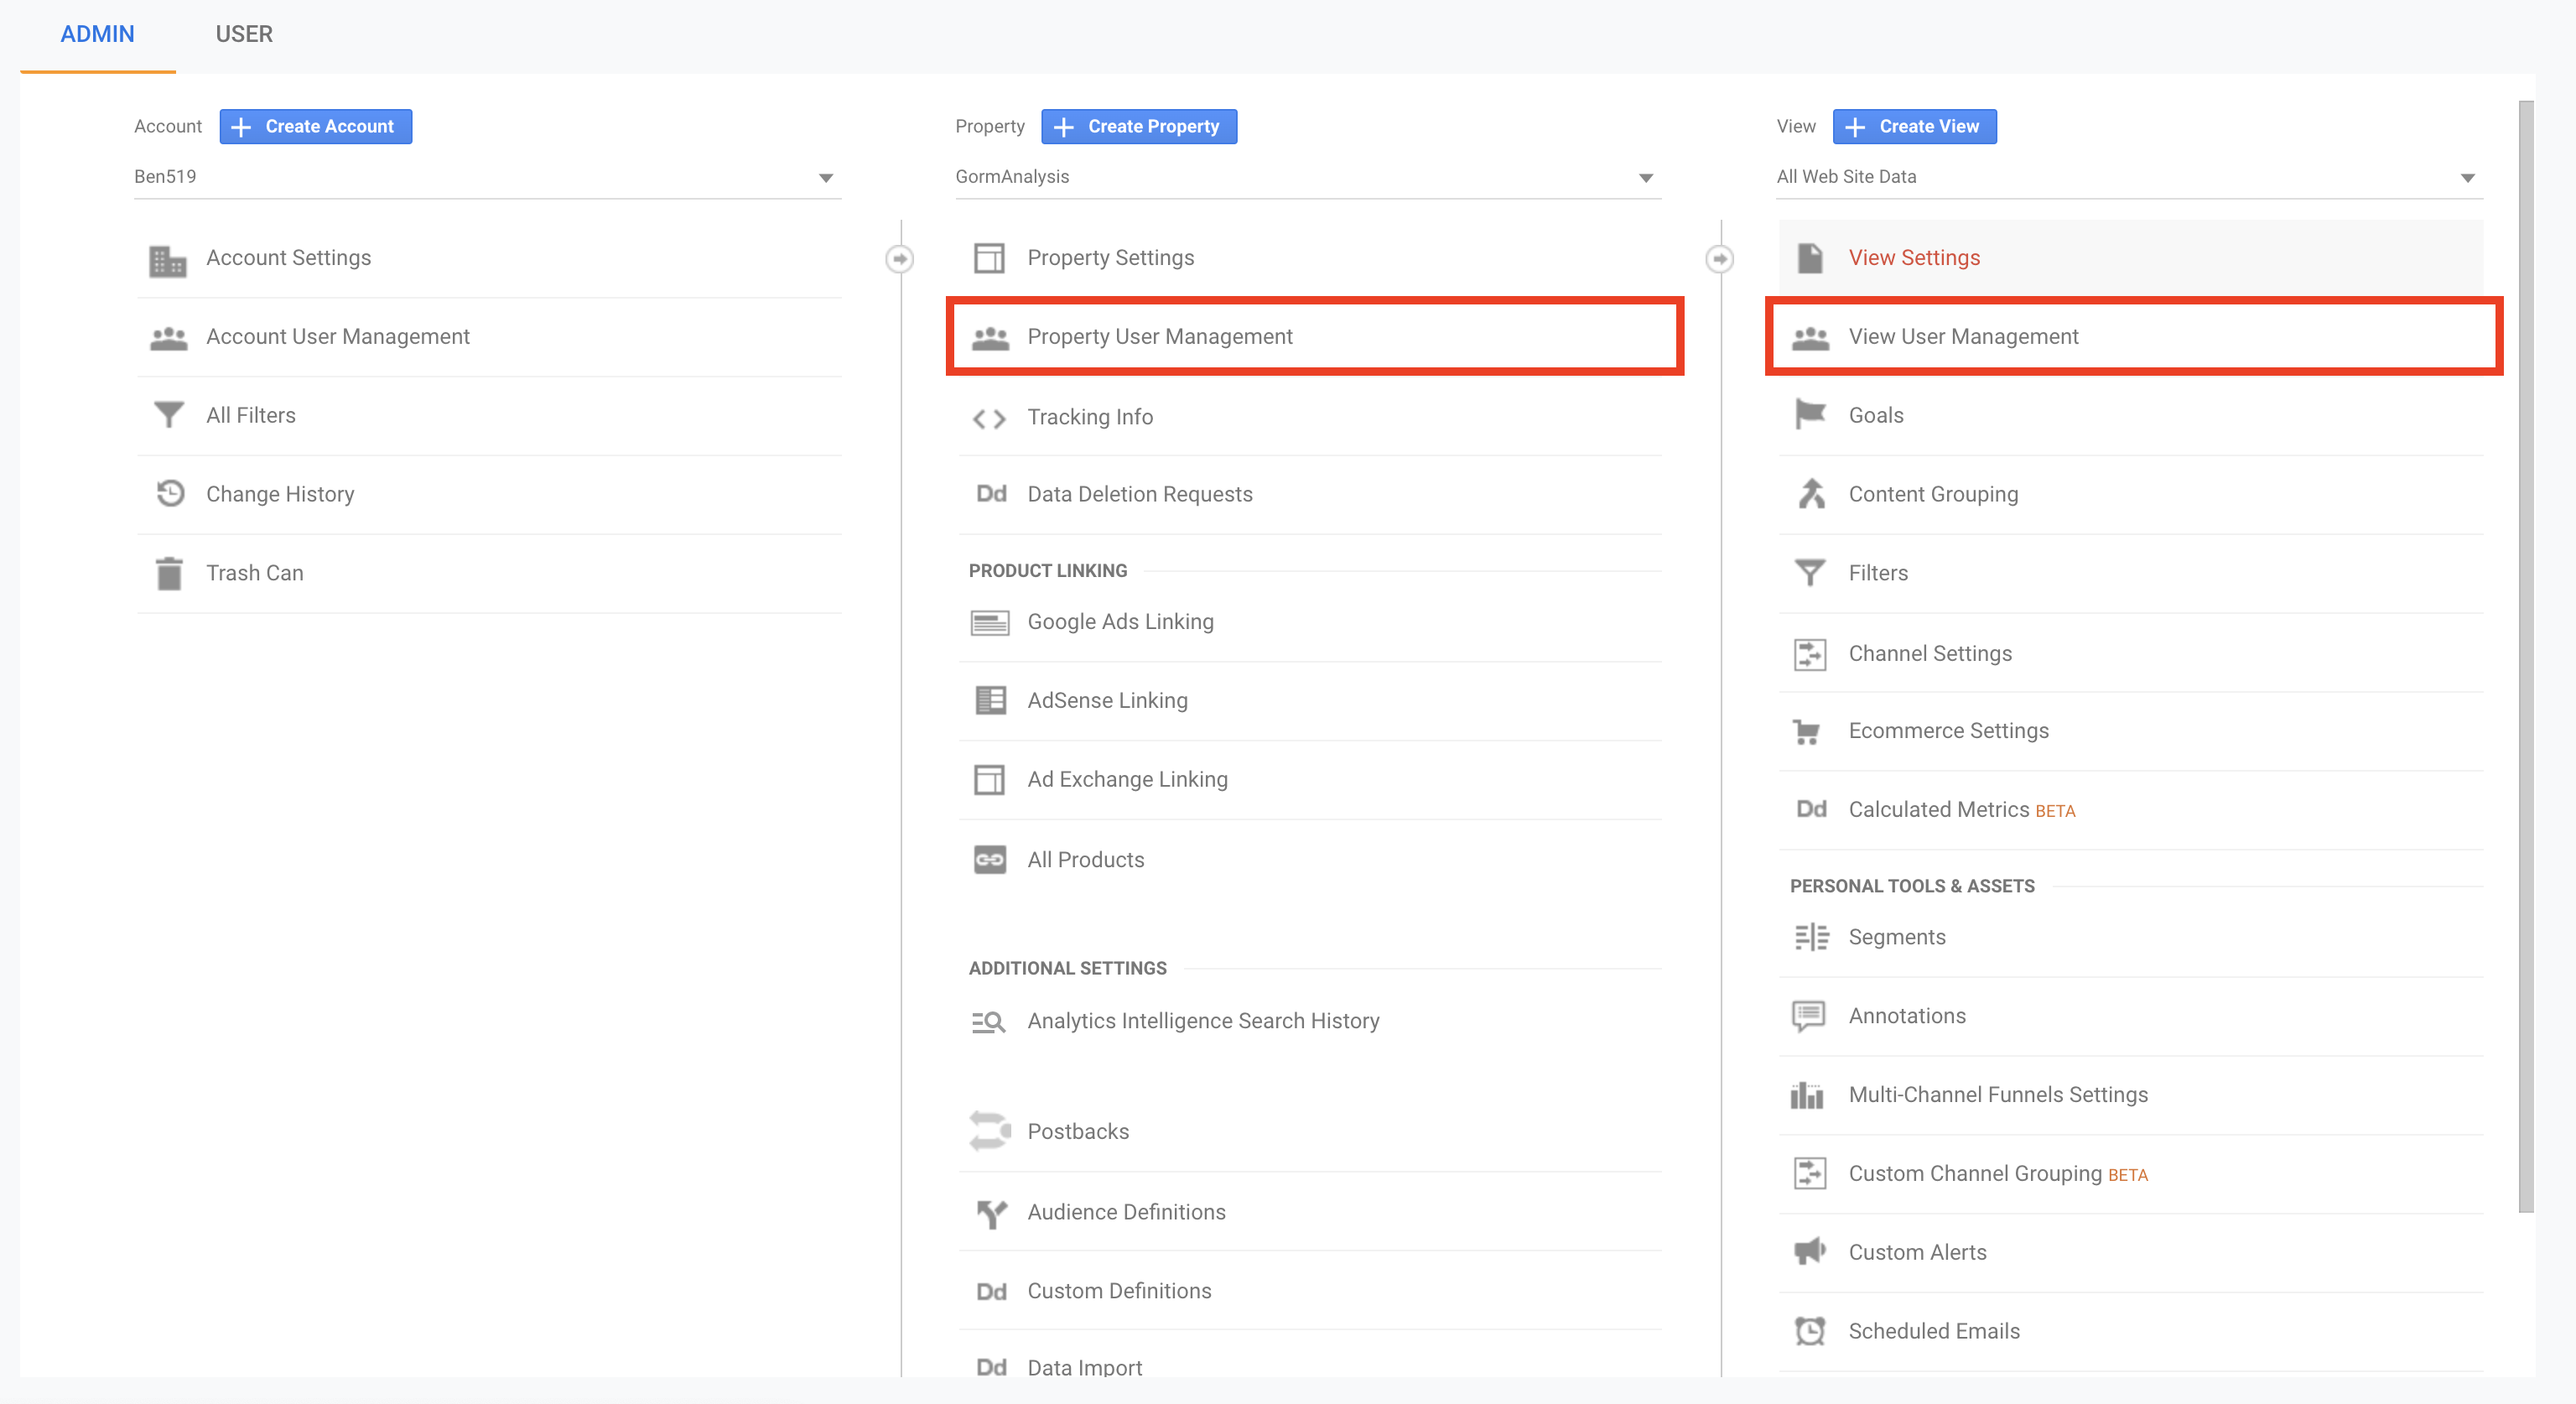
- From within Google Analytics, you’ll need to give permission to your newly created service account. If you go back to Manage Service Accounts (as in step 7), you’ll see the name of your new service account like gormanalysis-primary@gormanalysis.iam.gserviceaccount.com. Copy it. Then, in Google Analytics, go to the admin page. You’ll want to add your service account to both Property Users and View Users.
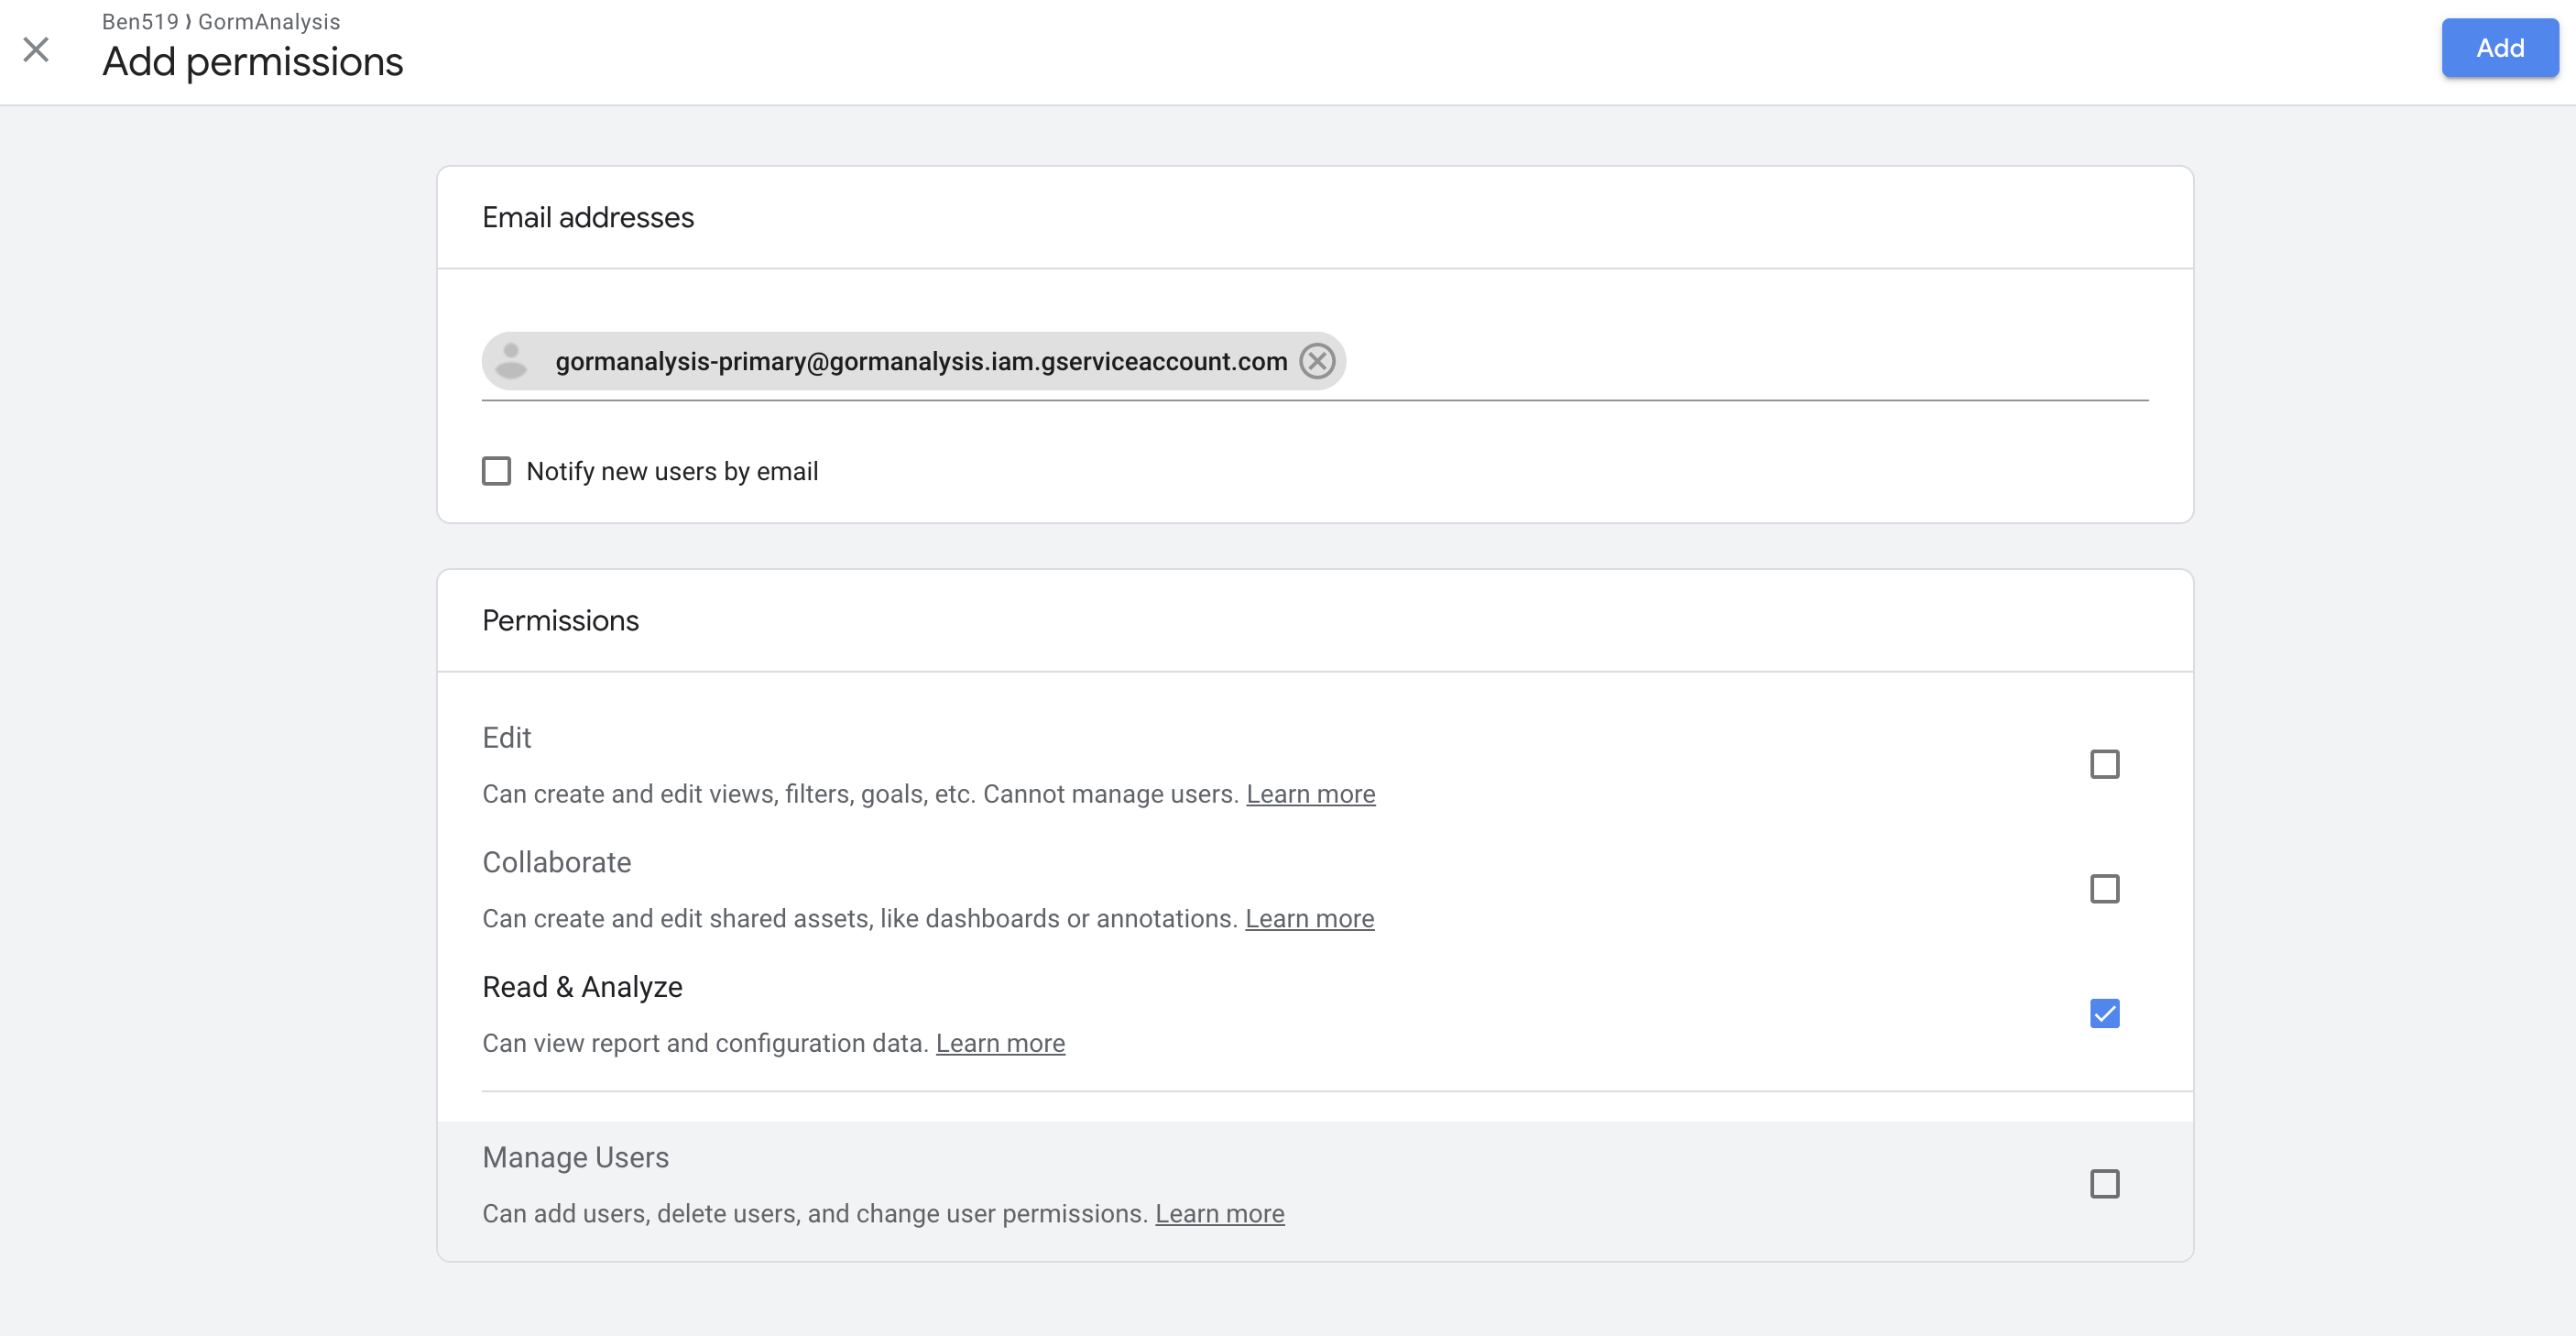
- Give your service account some permissions. For the purposes of this tutorial, read permissions are enough.
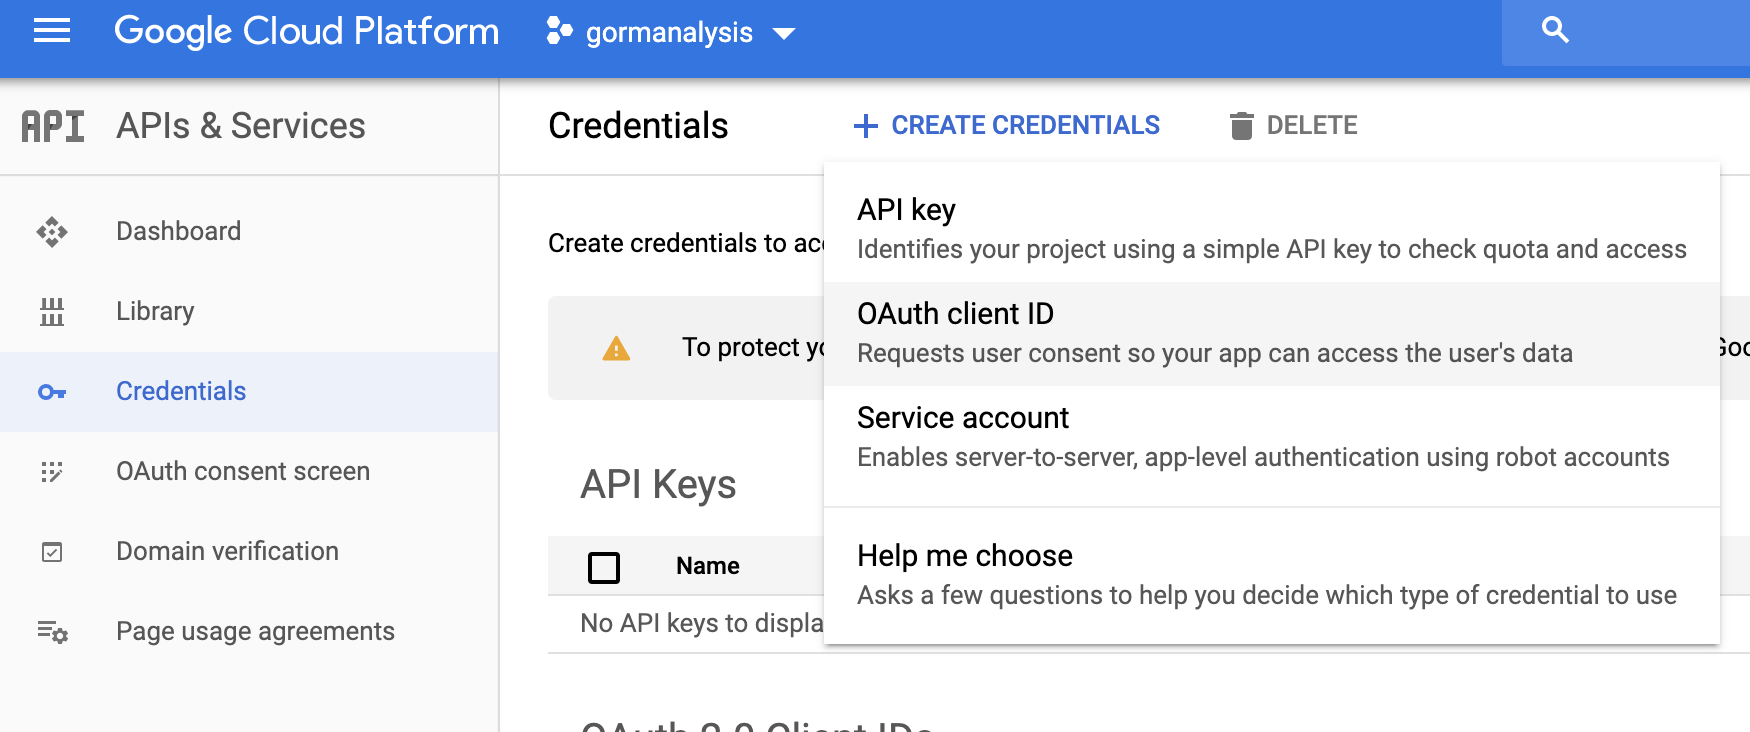
- Go back to the APIs & Services page in Google Cloud Platform and create a new OAuth client ID. Label the application type as “other” and give it a name.
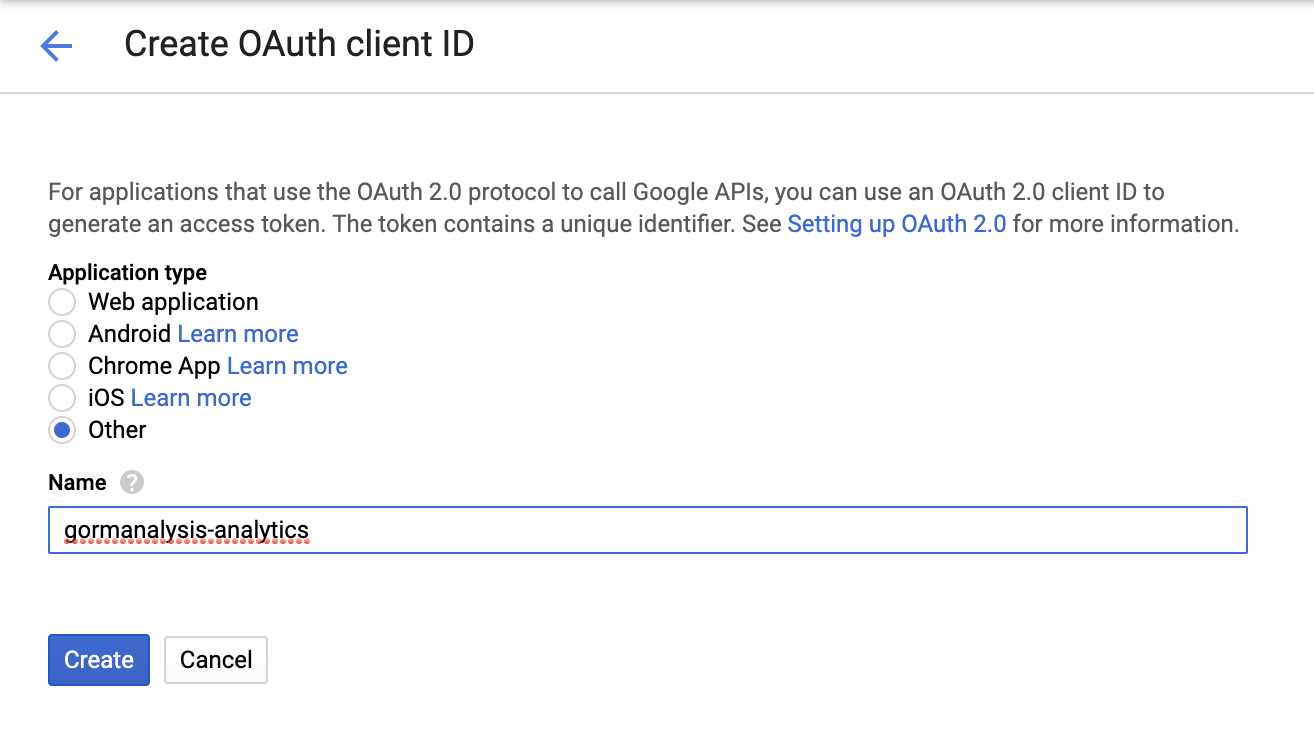
- Lastly, download the credentials for both your OAuth client account and Service account. These’ll be json files that you can use for authenticating.
Authenticate
Next we’ll use googleAuthR to authenticate to the googleAnalyticsR API, and we’ll give ourselves read only access.
# Authenticate
googleAuthR::gar_auth_service(
  json_file = "/Users/bgorman/Documents/Projects/R/googleAnalyticsR/gormanalysis-7b0c90a25f87.json",
  scope = "https://www.googleapis.com/auth/analytics.readonly"
)
googleAuthR::gar_set_client(
  json = "/Users/bgorman/Documents/Projects/R/googleAnalyticsR/client_secret.apps.googleusercontent.com.json",
  scopes = c("https://www.googleapis.com/auth/analytics.readonly")
)
## 2020-06-24 08:49:55> Setting client.id from  /Users/bgorman/Documents/Projects/R/googleAnalyticsR/client_secret.apps.googleusercontent.com.json
## [1] "gormanalysis"
Just to make sure this worked, let’s see the account details for our analytics user. Particularly, we’ll take note of any viewIds associated with our account, as we’ll need to use a viewId later on to request data about our site.
library(googleAnalyticsR)

# Query list of accounts
accounts <- ga_account_list()
accounts[, c("accountName", "webPropertyName", "viewId", "viewName")]
## # A tibble: 1 x 4
##   accountName webPropertyName viewId   viewName
##   <chr>       <chr>           <chr>    <chr>
## 1 Ben519      GormAnalysis    79581596 All Web Site Data
Sweet.
Now let’s use that viewId to see how many daily sessions my site had between 2020-03-20 and 2020-03-22.
sessions <- google_analytics(
  viewId = 79581596,
  date_range = c("2019-03-20", "2019-03-22"),
  metrics = "sessions",
  dimensions = "date"
)
## 2020-06-24 08:49:57> Downloaded [3] rows from a total of [3].
sessions
##         date sessions
## 1 2019-03-20      195
## 2 2019-03-21      197
## 3 2019-03-22      186
Now that we have a working code sample, let’s start pulling more useful and interesting data. (Continue to part 2)
 GormAnalysis